Previous analysis/position: Waiting patiently on the sidelines for further development. Price alerts set at $8,300 and $7,800.
Patterns: Higher lows and higher highers forming trend. 12h bull flag.
Horizontal support and resistance: R = $8,300 | weak S = $7,750 | strong S = $6,800
BTCUSDSHORTS: 60% long : 40% short is a sustainable ratio and indicates room left to rally.
Funding Rates: Longs pay shorts 0.041%
12 & 26 EMA’s (calculate % difference): 12 = +5.58% | 26 = +11.43% | 12 is following the trend line and is currently at horizontal support.
50 & 128 MA’s: 50 = +20.58% 128 = 7.51%
FIB’s: 0.382 = $8,496 | 0.5 = $10,677
Candlestick analysis: Daily hanging man forming. Monthly bullish engulfing.
Ichimoku Cloud: Inside daily cloud = no trade zone | 12h is turning fully bullish. | 4h fully bullish | 1h fully bullish with recent kumo breakout - finding resistance from Tenkan-Sen.
TD’ Sequential: 4th candle of the correction following G-9 on the daily. G-2 > G-1 on weekly.
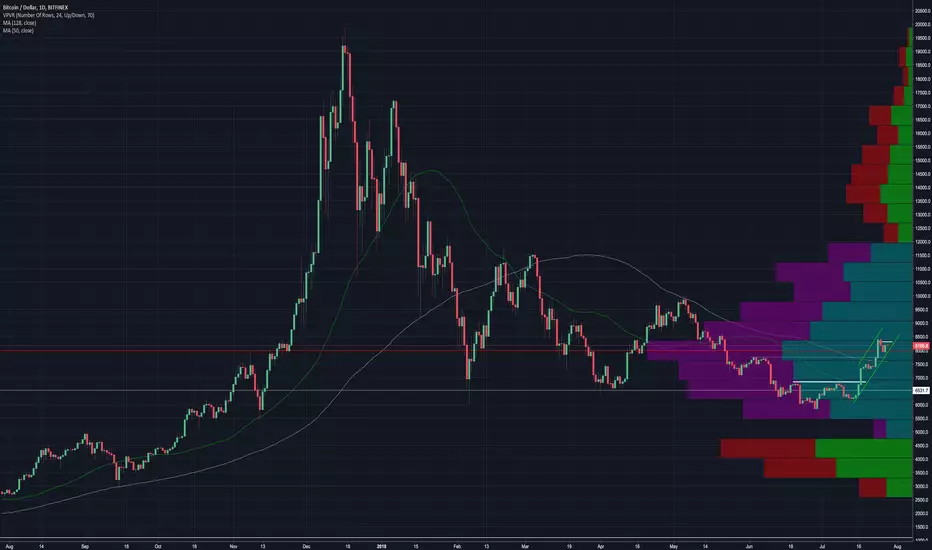
Visible Range: $8,180 has largest volume profile over last 24 hours. Price is currently resisting that price on the number. A breakdown would mean a pullback to $7,900 is highly likely. $8,200 has largest volume profile over last 5 days. Being back below that area of resistance is a bad sign for the bulls. $8,200 - $8,278 has a very significant volume profile over the past month. Resisting that area would mean a retest of $7,500 is highly likely. $7,972 has largest volume profile over the past year. That will be a very important price point for both bulls and bears. If we can stay above $8,400 then that would put the largest resistance in the rear view mirror.
BTC Price Spreadsheet: 12h = +/-0 | 24h = +0.68% | 1w = +10.29% | 2w = +28.77% | 1m = +25%
Bollinger Bands: Large bulge on daily, return to daily MA seems likely. Currently at $7,200. Back above the weekly MA.
Trendline: Connects 7/15 to 7/27
Daily Trend: Bearish | Lower highs and lower lows on 15 minute chart.
Fractals: UP = $8,515 DOWN = $7,224
On Balance Volume: Lower high/bear flag on daily.
Chaikin Money Flow: Still trending up with lower highs and higher lows.
Buy/Sell Sentiment on Trading View (countertrade): Oscillators = Buy | MA’s = Strong Buy | Summary = Buy
RSI: Daily = 67 and could be forming h&s | Weekly recently broke 50.
Stoch: Weekly looks healthy, daily is starting to angle down sharply.
Summary: Visible Range Volume Profile with a look back period of 1 year is by far the most important indicator for me right now. If we can breakthrough the current level of resistance then it would be my first major indication that this bear market is coming to an end. This is also the most time we have spent above the 128 day MA since January 30th when we first broke down $10,000. The Ichimoku Clouds are also getting bullish. A kumo breakout on the daily would occur at $8,800 and would be the first since the bear market has started. Nevertheless it is still too early to take a position. There is still an incoming death cross on the 50 & 30 week MA’s. If that stops us from breaking through $8,400 then a pullback to $4,800 - $4,950 would be strongly expected.
“As for me, I have no desire to carry the football from end zone to end zone. Just give me the territory between the 20 yard lines.” PeterLBrandt
Patterns: Higher lows and higher highers forming trend. 12h bull flag.
Horizontal support and resistance: R = $8,300 | weak S = $7,750 | strong S = $6,800
BTCUSDSHORTS: 60% long : 40% short is a sustainable ratio and indicates room left to rally.
Funding Rates: Longs pay shorts 0.041%
12 & 26 EMA’s (calculate % difference): 12 = +5.58% | 26 = +11.43% | 12 is following the trend line and is currently at horizontal support.
50 & 128 MA’s: 50 = +20.58% 128 = 7.51%
FIB’s: 0.382 = $8,496 | 0.5 = $10,677
Candlestick analysis: Daily hanging man forming. Monthly bullish engulfing.
Ichimoku Cloud: Inside daily cloud = no trade zone | 12h is turning fully bullish. | 4h fully bullish | 1h fully bullish with recent kumo breakout - finding resistance from Tenkan-Sen.
TD’ Sequential: 4th candle of the correction following G-9 on the daily. G-2 > G-1 on weekly.
Visible Range: $8,180 has largest volume profile over last 24 hours. Price is currently resisting that price on the number. A breakdown would mean a pullback to $7,900 is highly likely. $8,200 has largest volume profile over last 5 days. Being back below that area of resistance is a bad sign for the bulls. $8,200 - $8,278 has a very significant volume profile over the past month. Resisting that area would mean a retest of $7,500 is highly likely. $7,972 has largest volume profile over the past year. That will be a very important price point for both bulls and bears. If we can stay above $8,400 then that would put the largest resistance in the rear view mirror.
BTC Price Spreadsheet: 12h = +/-0 | 24h = +0.68% | 1w = +10.29% | 2w = +28.77% | 1m = +25%
Bollinger Bands: Large bulge on daily, return to daily MA seems likely. Currently at $7,200. Back above the weekly MA.
Trendline: Connects 7/15 to 7/27
Daily Trend: Bearish | Lower highs and lower lows on 15 minute chart.
Fractals: UP = $8,515 DOWN = $7,224
On Balance Volume: Lower high/bear flag on daily.
Chaikin Money Flow: Still trending up with lower highs and higher lows.
Buy/Sell Sentiment on Trading View (countertrade): Oscillators = Buy | MA’s = Strong Buy | Summary = Buy
RSI: Daily = 67 and could be forming h&s | Weekly recently broke 50.
Stoch: Weekly looks healthy, daily is starting to angle down sharply.
Summary: Visible Range Volume Profile with a look back period of 1 year is by far the most important indicator for me right now. If we can breakthrough the current level of resistance then it would be my first major indication that this bear market is coming to an end. This is also the most time we have spent above the 128 day MA since January 30th when we first broke down $10,000. The Ichimoku Clouds are also getting bullish. A kumo breakout on the daily would occur at $8,800 and would be the first since the bear market has started. Nevertheless it is still too early to take a position. There is still an incoming death cross on the 50 & 30 week MA’s. If that stops us from breaking through $8,400 then a pullback to $4,800 - $4,950 would be strongly expected.
“As for me, I have no desire to carry the football from end zone to end zone. Just give me the territory between the 20 yard lines.” PeterLBrandt
emasar Indicator is available for purchase at alphanalysis.io/product/emasar/
Disclaimer
The information and publications are not meant to be, and do not constitute, financial, investment, trading, or other types of advice or recommendations supplied or endorsed by TradingView. Read more in the Terms of Use.