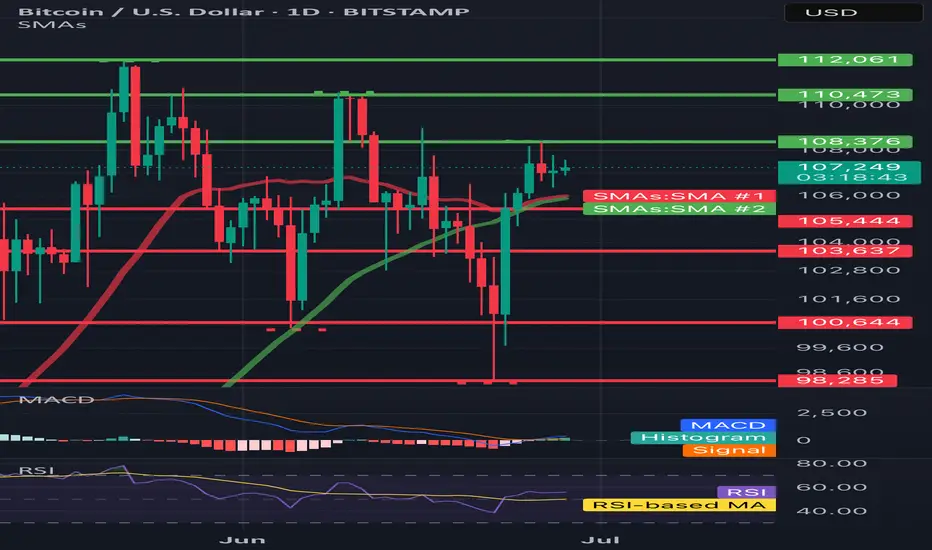
Hello everyone, let's look at the 1D BTC chart to USD, in this situation we can see how the 3rd peak formed us and we are currently fighting to maintain the price or a potential output up if we do not see a try to break out, you can expect a stronger relief.
However, let's start by defining goals for the near future the price must face:
T1 = 108376 $
T2 = 110473 $
Т3 = 112061 $
Let's go to Stop-Loss now in case of further declines on the market:
SL1 = 105444 $
SL2 = 103637 $
SL3 = 100644 $
SL4 = 98285
Looking at the RSI indicator, we see
As we entered the upper part of the indicator again, however, there is still a place to try to grow.
Disclaimer
The information and publications are not meant to be, and do not constitute, financial, investment, trading, or other types of advice or recommendations supplied or endorsed by TradingView. Read more in the Terms of Use.
Disclaimer
The information and publications are not meant to be, and do not constitute, financial, investment, trading, or other types of advice or recommendations supplied or endorsed by TradingView. Read more in the Terms of Use.