150 straight days of posting the daily update. If you want to improve your TA then that is how to do it! It isn't about which indicators your use or don't use, it is about developing a consistent process. Thank you very much to everyone who takes the time to like and comment, it is greatly appreciated!
Previous analysis/position: Remain a bear sitting on the sidelines. Watching the 50 week MA and 0.382 FIB for resistance. Waiting for death cross from 30 and 50 week MA.
Patterns: Higher highs and higher lows forming a trend.
Horizontal support and resistance: S = $7,814 R = $8,475
BTCUSDSHORTS: Testing 18,500 for support. If that doesn’t hold then shorts could drop all the way to 8,800
Funding Rates: Longs pay 0.0404%
12 & 26 EMA’s (calculate % difference): 12 = +7.07% | 26 = +13.27% | Starting to posture up on the weekly. Will it get a bullish crossover?
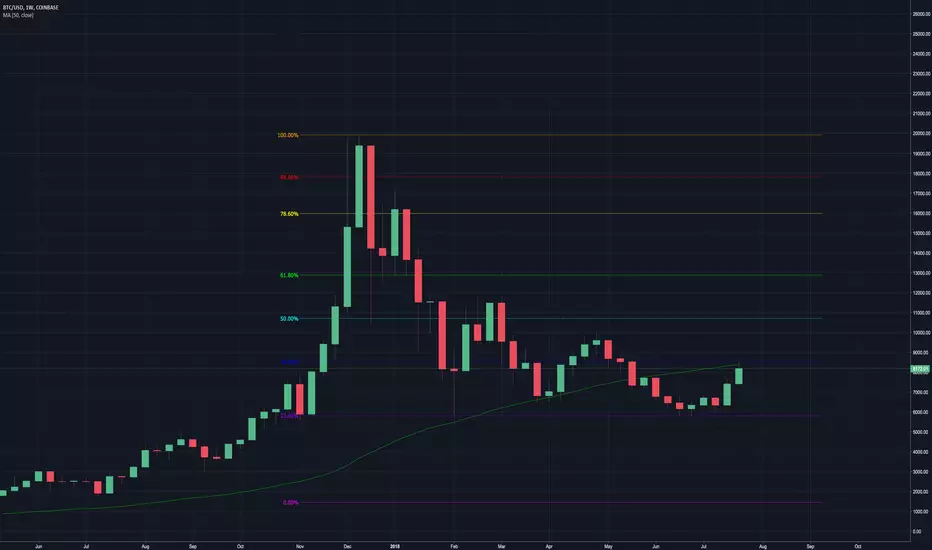
50 & 128 MA’s: 50 = +21.70% 128 = +7.83%
FIB’s: 0.382 = $8,496 | 0.5 = $10,677
Candlestick analysis: Monthly bullish engulfing
Ichimoku Cloud: Daily is bullish, support from Tenkan. 12h starting to form c clamp. 1h cloud is bearish and currently acting as resistance.
TD’ Sequential: Green 3 following 9 on the sell setup. Green 2 above a green 1 on the weekly with a 10 on the sell countdown.
Visible Range: $8,200 has the second largest volume profile over the past 24 hours and is currently being tested for resistance. $8,200 has the largest volume profile over the past 5 days and 3rd largest over past 1 month. $7,600 to $8,335 has the largest volume profile over the past year. Breaking that level with conviction would be very significant.
BTC Price Spreadsheet: 12h = +3.97% | 24h = +/- 0 | 1w = +12.13% | 2w = +31.39% | 1m = +36.03%
Bollinger Bands: Pulled back inside top band on daily. MA = $7,151 Back on top of the weekly MA.
Trendline: Connects 7/16 to 7/23
Daily Trend: Choppy. Starting to turn bullish.
Fractals: UP = $8,500 DOWN = $7,237
On Balance Volume: Daily, weekly and monthly look healthy with no divs.
Chaikin Money Flow: Created a higher low and found support at 0.1 on the daily. Broke 0.23 resistance on the weekly. Will it break 0.05?
Buy/Sell Sentiment on Trading View (countertrade): Oscillators = Buy | MA’s = Strong Buy | Summary = Buy
RSI: Daily found support at 65, will it get back above 70 or form a h&s? Weekly just crossed 50.
Stoch: Recent sell signal on daily, still has plenty of room to go on the weekly.
Summary: Continue to sit back and wait to see how far this rally can go. I will remain a bear until the longer term MA’s are in a bullish posture and the price is on top of them. Until that happens we are still in a bear market. If we can get back above $10,000 then it is very likely that my conditions for a bull market will be met. Until then I will remember that even if that was the bottom, the bulls are still inside their own 20 yard line.
“As for me, I have no desire to carry the football from end zone to end zone. Just give me the territory between the 20 yard lines.” PeterLBrandt
Previous analysis/position: Remain a bear sitting on the sidelines. Watching the 50 week MA and 0.382 FIB for resistance. Waiting for death cross from 30 and 50 week MA.
Patterns: Higher highs and higher lows forming a trend.
Horizontal support and resistance: S = $7,814 R = $8,475
BTCUSDSHORTS: Testing 18,500 for support. If that doesn’t hold then shorts could drop all the way to 8,800
Funding Rates: Longs pay 0.0404%
12 & 26 EMA’s (calculate % difference): 12 = +7.07% | 26 = +13.27% | Starting to posture up on the weekly. Will it get a bullish crossover?
50 & 128 MA’s: 50 = +21.70% 128 = +7.83%
FIB’s: 0.382 = $8,496 | 0.5 = $10,677
Candlestick analysis: Monthly bullish engulfing
Ichimoku Cloud: Daily is bullish, support from Tenkan. 12h starting to form c clamp. 1h cloud is bearish and currently acting as resistance.
TD’ Sequential: Green 3 following 9 on the sell setup. Green 2 above a green 1 on the weekly with a 10 on the sell countdown.
Visible Range: $8,200 has the second largest volume profile over the past 24 hours and is currently being tested for resistance. $8,200 has the largest volume profile over the past 5 days and 3rd largest over past 1 month. $7,600 to $8,335 has the largest volume profile over the past year. Breaking that level with conviction would be very significant.
BTC Price Spreadsheet: 12h = +3.97% | 24h = +/- 0 | 1w = +12.13% | 2w = +31.39% | 1m = +36.03%
Bollinger Bands: Pulled back inside top band on daily. MA = $7,151 Back on top of the weekly MA.
Trendline: Connects 7/16 to 7/23
Daily Trend: Choppy. Starting to turn bullish.
Fractals: UP = $8,500 DOWN = $7,237
On Balance Volume: Daily, weekly and monthly look healthy with no divs.
Chaikin Money Flow: Created a higher low and found support at 0.1 on the daily. Broke 0.23 resistance on the weekly. Will it break 0.05?
Buy/Sell Sentiment on Trading View (countertrade): Oscillators = Buy | MA’s = Strong Buy | Summary = Buy
RSI: Daily found support at 65, will it get back above 70 or form a h&s? Weekly just crossed 50.
Stoch: Recent sell signal on daily, still has plenty of room to go on the weekly.
Summary: Continue to sit back and wait to see how far this rally can go. I will remain a bear until the longer term MA’s are in a bullish posture and the price is on top of them. Until that happens we are still in a bear market. If we can get back above $10,000 then it is very likely that my conditions for a bull market will be met. Until then I will remember that even if that was the bottom, the bulls are still inside their own 20 yard line.
“As for me, I have no desire to carry the football from end zone to end zone. Just give me the territory between the 20 yard lines.” PeterLBrandt
emasar Indicator is available for purchase at alphanalysis.io/product/emasar/
Disclaimer
The information and publications are not meant to be, and do not constitute, financial, investment, trading, or other types of advice or recommendations supplied or endorsed by TradingView. Read more in the Terms of Use.