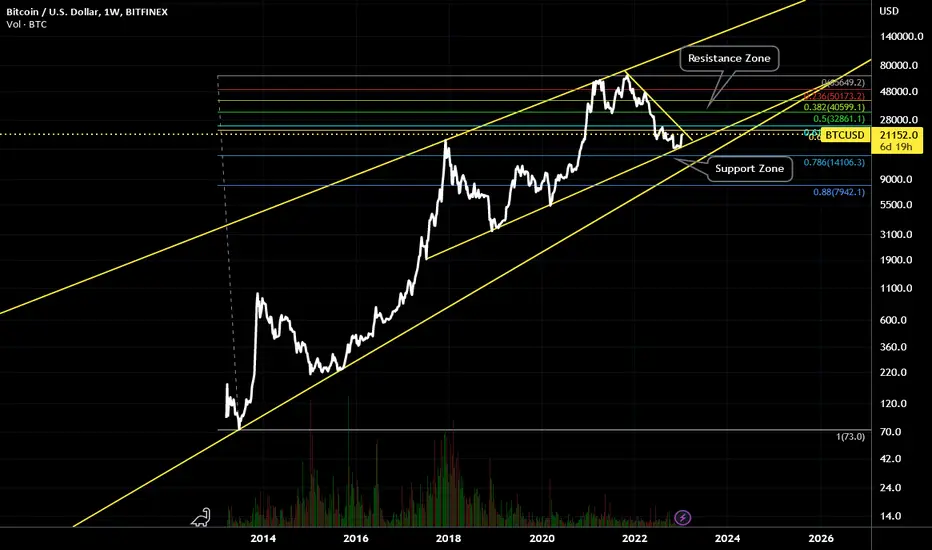
Bitcoin (BTC/USD) cryptocurrency price is attempting to bounce up from a yearly trendline support zone price of $16000.
Bullish scenario: Price could continue to rise and breakout through resistances above. Resistance targets above would be $25000, $32000, $40000, etc. A true breakout would need price to close above $25000 and continue a sustained uptrend rally.
Bearish scenario: Price falls to further test support levels below. Support targets below would be $14000, $10000, $8000, etc. If price were to fall down and close below $16000, the downtrend could continue.
In this weekly chart, the yellow trendlines represent long-term support & resistance price level zones (e.g. 1-year, 5-year, 9-year time lengths of price data).
note: be aware of any breaking/global/fundamental news that could override technical chart setups.
this bitcoin chart is on a weekly time frame, logarithmic scale.
Follow Me on TradingView, Youtube, X, Instagram.
Social Media links are in my profile.
Boost, comment, share to support.
All posts are not financial advice.
Social Media links are in my profile.
Boost, comment, share to support.
All posts are not financial advice.
Disclaimer
The information and publications are not meant to be, and do not constitute, financial, investment, trading, or other types of advice or recommendations supplied or endorsed by TradingView. Read more in the Terms of Use.