BTCUSD is currently making the biggest decline of 2019, having pulled back by more than -25% since last week's High. Even though the 1W bullish trend is intact (RSI = 68.528, MACD = 1367.700), 1D neutral (RSI = 51.683) and about to turn bearish (Highs/Lows = -54.6254).
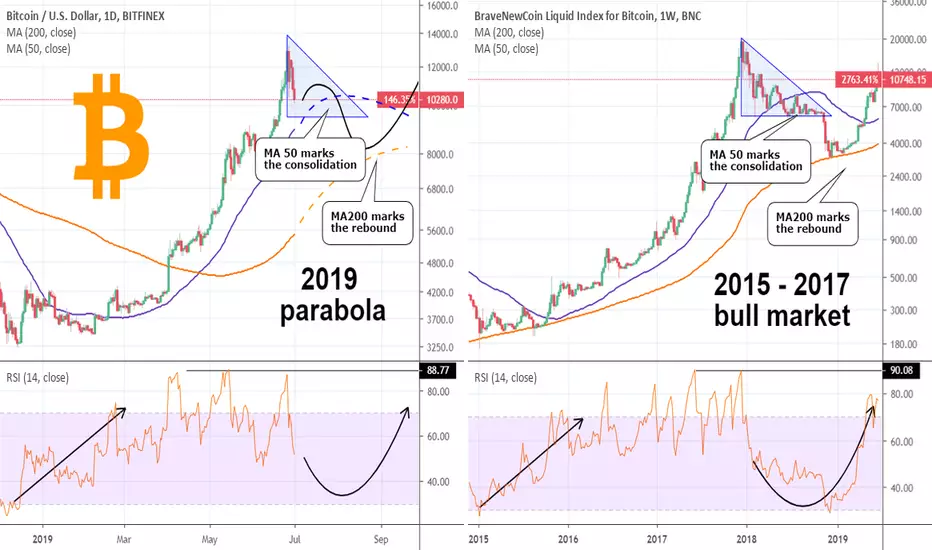
A quick comparison of the current 1D parabola with the parabolic behavior of the previous bullish cycle (on the 1W time frame) shows some similarities both on the candle action and the RSI pattern.
According to the 2018 candle action, the price should pull back near the last red candle before the peak (was 6000 then, is 9000 now) and then consolidate within a Descending Triangle, cross the MA50 sideways before making a final dive to touch the MA200. That test marks the rebound and continuation of the long term bullish trend.
The time frames are of course different but the similarities of the parabolic behavior quite obvious. At this stage buying those 2 dips should work well on the long run.
Telegram: t.me/investingscope
investingscope.com
Over 65% accuracy on Private Signals Channel.
Over 15% return monthly on our Account Management Plan.
Account RECOVERY services.
Free Channel: t.me/investingscopeofficial
investingscope.com
Over 65% accuracy on Private Signals Channel.
Over 15% return monthly on our Account Management Plan.
Account RECOVERY services.
Free Channel: t.me/investingscopeofficial
Disclaimer
The information and publications are not meant to be, and do not constitute, financial, investment, trading, or other types of advice or recommendations supplied or endorsed by TradingView. Read more in the Terms of Use.