
A month ago I first suggested the idea that the current correction may be another Bear Cycle and that as Bitcoin gets more institutionalized and achieves further adoption, these 'smoother' Bear Cycles may be the norm from now on:
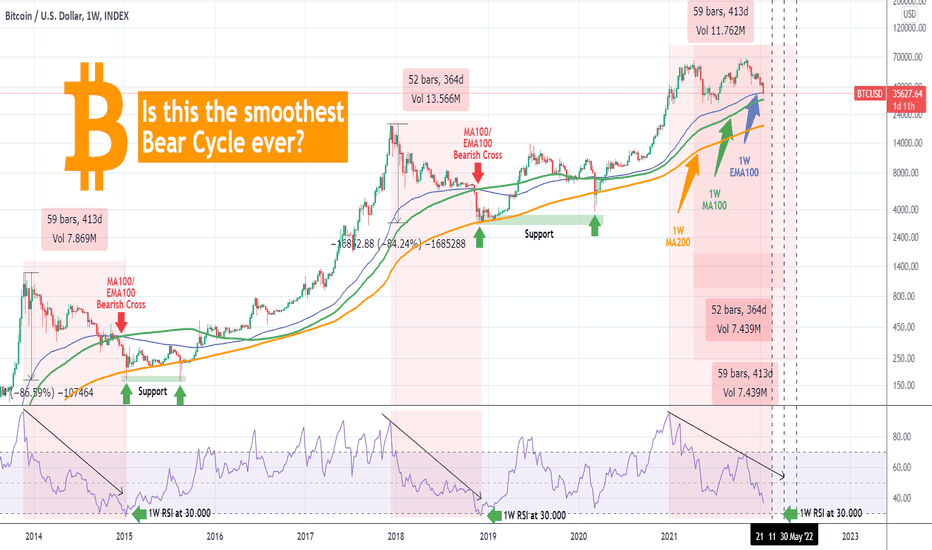
This time I take it a step further and compare the 2021/22 correction with that of 2019/20. Now, I need to state the obvious before we begin, that 2020 had the Black Swan of the COVID outbreak, an (anomaly) event that only happens once in 100 years and can't be comparable to anything we have in our samples. However even if we filter this out, we find interesting similarities between the two periods.
Using the Gaussian Channel, we get a better sense of the cyclical behavior of phases and the net volume indicator on the stages. Both fractals initially made a slight break below the 1W MA50 (red trend-line), recovered but later broke again below it significantly. Only when the price recovered both the 1W MA50 and the 1D MA200 (orange trend-line), was the recovery confirmed and the new parabolic rally of 2020 could begin. At the moment it seems BTC is in that stage of attempting to break above this MA zone.
Notice also the importance of Net Volume in all of this. Even before they reached their respective peaks, the volume started to descend. In 2020, the big volume spike started around the time Bitcoin broke about that MA zone I mentioned (1W MA50 - 1D MA200). It seems like such a big volume spike is needed in order to say with some degree of certainty that Bitcoin has resumed the bullish trend towards new All Time High.
So what do you think about this analysis? Are such corrections the new norm of a Bear Cycle and if so can 2020 be a guide for 2022? Feel free to share your work and let me know in the comments section below!
--------------------------------------------------------------------------------------------------------
Please like, subscribe and share your ideas and charts with the community!
--------------------------------------------------------------------------------------------------------
👑Best Signals (Forex/Crypto+70% accuracy) & Account Management (+20% profit/month on 10k accounts)
💰Free Channel t.me/tradingshotglobal
🤵Contact info@tradingshot.com t.me/tradingshot
🔥New service: next X100 crypto GEMS!
💰Free Channel t.me/tradingshotglobal
🤵Contact info@tradingshot.com t.me/tradingshot
🔥New service: next X100 crypto GEMS!
Disclaimer
The information and publications are not meant to be, and do not constitute, financial, investment, trading, or other types of advice or recommendations supplied or endorsed by TradingView. Read more in the Terms of Use.