Bitcoin (BTC/USD) Technical Analysis – June 24, 2025
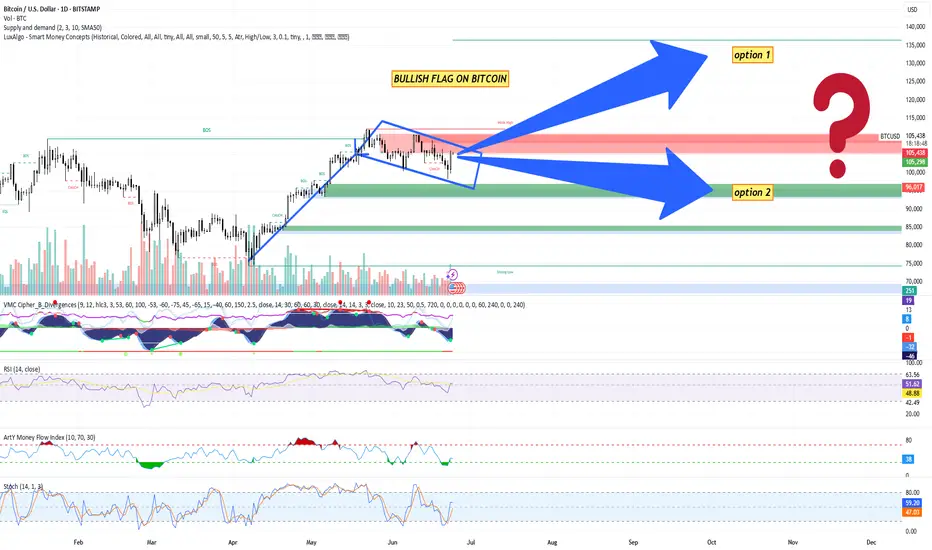
Pattern Identified: Bullish Flag Formation
A clear upward impulse leg followed by a downward-sloping consolidation (flag) indicates a continuation pattern.
The flag is bounded within a descending parallel channel, suggesting a potential breakout to the upside.
Break of Structure (BOS): Multiple BOS signals indicate strong market structure shifts favoring bullish continuation.
Change of Character (CHOCH): Minor CHOCH noted inside the flag, indicating local liquidity grabs but no trend reversal yet.
Key Levels
Current Price: ~$105,126
Flag Resistance: ~$105,291 (watch for breakout)
Major Supply Zone (Resistance): ~$115,000 (red zone)
Demand Zones (Supports):
$96,000 (minor)
$85,000 (medium strength)
$75,000 - $70,000 (strong low / high-confluence area)
Volume Analysis
Declining volume during flag formation supports the bullish flag hypothesis (low-volume pullback).
Anticipate increased volume on breakout for confirmation.
Indicators Summary
1. VMC Cipher B
Green dots signal potential local bottoms.
Wave trends support bullish reversal setup, though momentum still neutral.
2. RSI (14)
Current RSI: ~50.76
Neutral zone; not overbought/oversold – provides room for upside movement.
3. Money Flow Index (Art’y)
Positive inflow recovering, signaling accumulation phase.
4. Stochastic RSI
Blue line crossing above orange around 46. Indicates bullish crossover from the oversold region – early entry signal.
Bitcoin Trading Plan
Trading Bias: Bullish (Contingent on Flag Breakout)
Entry Plan
Breakout Entry: Enter long above $105,300 with confirmation (4H or daily candle close).
Aggressive Entry: Pre-breakout entry inside the flag at ~$104,000–$105,000, anticipating breakout.
Stop Loss
Conservative: Below $96,000 (below key support + 50 SMA).
Aggressive: Below $102,500 (inside flag, tighter stop).
Take Profit Levels
TP1: $110,000 (local high)
TP2: $115,000 (strong resistance zone)
TP3: $123,000–$125,000 (measured move from flag breakout target)
Measured Move Target: Height of the pole ($25K) added to the breakout zone ($105K) = Target zone: $130,000 (theoretical).
Alternative Scenario – Bearish Breakdown
If BTC breaks below $96,000, the bullish structure is invalidated.
In that case:
Look for short entries below $95,500.
Target zone: $85,000 – $75,000.
SL above $98,000.
Risk Management Guidelines
Risk per trade: 1–2% of capital
Use position sizing tools to determine trade size.
Monitor macroeconomic news (Fed, inflation, ETF flows) and crypto market sentiment.
To sum up things:
BTC is consolidating within a textbook bullish flag.
Momentum indicators align with a potential breakout.
Caution warranted until clear breakout occurs – volume confirmation is key.
Keep alert for fakeouts due to low summer volatility.
Disclaimer
The information and publications are not meant to be, and do not constitute, financial, investment, trading, or other types of advice or recommendations supplied or endorsed by TradingView. Read more in the Terms of Use.
Disclaimer
The information and publications are not meant to be, and do not constitute, financial, investment, trading, or other types of advice or recommendations supplied or endorsed by TradingView. Read more in the Terms of Use.