Hey Friends,
This is an update analysis on Bitcoin. I want to preface that this is a mid ranged idea just to give you some perspective, I'm thinking this idea should take about a month and a half. I'm sorry the chart is a little messy, there's a lot going on, but I want to point out these various significant levels.
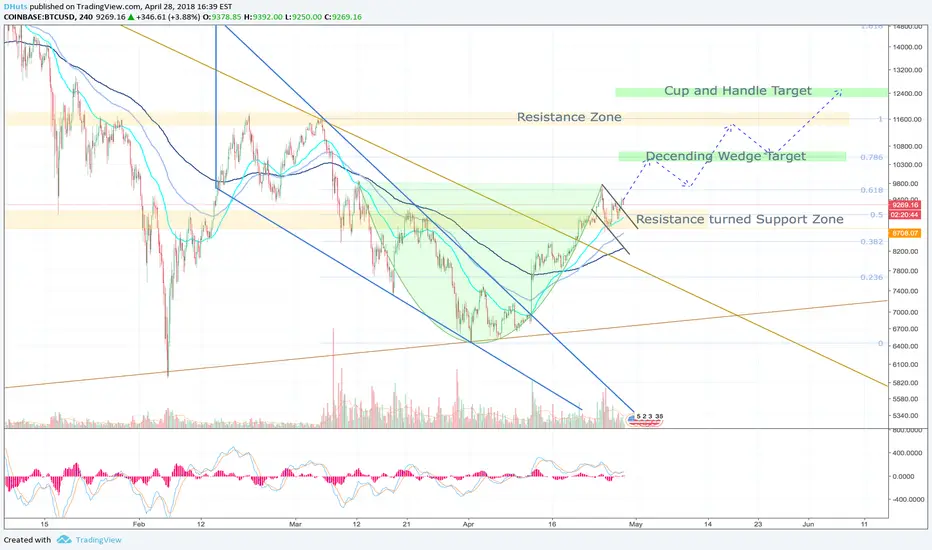
I'm seeing a cup and handle on Bitcoin's 4h chart. Looking back at the history I've hilighted a couple areas of support/resistance in yellow. You can see how many times those zones were tested, which makes them more significant.
You can also see the EMA's have flipped from bearish to bullish and are now providing support.
Looking at the Fibinacci's I'm expecting a nice stairstep climb higher. I think it's too early for too much FOMO but then again I could be wrong and we could skip the retest of the .618 and head straight up to the 1, but I'm hoping for the stair step climb so that we continue to record higher highs and lower lows and build investor and market confidence.
I've still have the Decending wedge pattern in my scope I think that level becomes more significant as we move forward.
Like it if you like it, and comment if you have questions, I'm happy to answer.
**This is educational information only, please do your own research before trading**
This is an update analysis on Bitcoin. I want to preface that this is a mid ranged idea just to give you some perspective, I'm thinking this idea should take about a month and a half. I'm sorry the chart is a little messy, there's a lot going on, but I want to point out these various significant levels.
I'm seeing a cup and handle on Bitcoin's 4h chart. Looking back at the history I've hilighted a couple areas of support/resistance in yellow. You can see how many times those zones were tested, which makes them more significant.
You can also see the EMA's have flipped from bearish to bullish and are now providing support.
Looking at the Fibinacci's I'm expecting a nice stairstep climb higher. I think it's too early for too much FOMO but then again I could be wrong and we could skip the retest of the .618 and head straight up to the 1, but I'm hoping for the stair step climb so that we continue to record higher highs and lower lows and build investor and market confidence.
I've still have the Decending wedge pattern in my scope I think that level becomes more significant as we move forward.
Like it if you like it, and comment if you have questions, I'm happy to answer.
**This is educational information only, please do your own research before trading**
Note
Updated the Handle looks like it wasn't as steep as I originally thought.
Note
You can see this Faint Blue Sym Triangle that I've drawn within the handle that formed just above our resistance line...
Also an inverse H&S has completed... This could be our breakout
Note
Keeping an open mind we may have an Ascending Wedge pattern forming near the edge of the Symmetrical Triangle. we could retest the support zone one more time before breaking out. We will see how it plays out
Note
We have a confirmed breakout on the hourly, waiting for the confirmation on the 4H
This is the best place to stock up before 10k, buy the dip
Note
#ShortSqueezeNote
The Cup and Handle completes to reveal it was hidden in an inverse Head and Shoulders all along.
I called a scenario like this in my post on Aril 17th. I assumed the neckline would be sloping lower but because that small red Head and shoulders didn't break to its full potential it shifted the neckline up. The neckline of the one that actually formed is flat and strong! see my original call here:
Note
#BuyTheDip ... Educational purposes only.This is a retest of the orange fib level, this is what they mean by buy the dip
Note
I hope you got a chance to buy the dip if you are a Long Holder.
Movement has slowed WAY down compared to earlier today, so we look at a closer timeframe to get an idea of where we are headed and I'd like to think we are headed up, my bias is bullish.
There is a small cause for correction on the 15 min chart depending on how it plays out but I am seeing a small Diamond being formed. We don't know yet if it is a Diamond top or a Diamond Continuation pattern. I'm thinking the later. But if it does break down to the downside we would likely test the EMA's, specifically the 50 EMA on the 4H chart. If the Diamond Breaks out to the upside showing a continuation then we can expect another pump to the 10K range, give or take 100. Exciting Stuff.
Note
That small diamond pattern continued upword and morphed into an Ascending Triangle on the 30 min. This is a very bullish development.
if you think of price action as kicking in the door that is the resistance line at 9,800, the more times it kicks without falling lower, the more the chance is we will break through we've already tested the 9,800 resistance and held resistance 3 times on the 30 min. chart. Chances of us moving higher are greater than of us moving lower. Should see 10K soon than I originally expected.
Note
Another higher low as we bounce off of the 50 EMA on the 30 min chart. Looks like we will continue up to knock on 9,800's door once more. Will this be the time we kick it in? The technicals are saying yes, but as always, we shall see.
Note
Lift off
Note
A clear retest of the top of the Ascending triangle to confirm it as support (very bullish) and now we are headed higher to 10K. We will see 10K probably today, this will be a critical zone and I expect consolidation. But if volume increases there then we may be on the next rocket. We shall see. Next stop after that is the Descending wedge zone.
Note
So we tested 10k and were turned away. We are noe looking to test the upward sloping trendline.If we break below it we will test 9k and the EMAs, If we fail at 9k and at the EMAs we will most likely head for a much lower correstion.
I pulled out of ETH because the market is spooked by the SEC in anticipation over tomorrows meeting. Investors hate uncertainty so I'm in cash for those positions. If ETH and XRP are declared securities then there will be a ripple (no pun intended) through the market. But that will be a great time to buy becuase regulation is a good thing. It will make more people comfortable with crypto in the long run and will increase adoption. So IF we go lower just be in a position to be able to buy the dip.
Note
King Bitcoin, with a perfect trend line bounce, we are still looking bullish friends. "So the [SEC] won't let me be
Or let me be me, so let me see
They try to shut me down on MTV
But it feels so empty without me" - Crypto Shady haha
Note
We are headed lower my friends. We failed to hold the trendline and momentum has slowed. I'm looking for a test of 8,500 possibly down to 8k. We shall see, I'll update then
Note
Sorry 8,800 first, then 8,500, 8,000.Note
Was headed to bed, so I couldnt wait for confirmation, but it appears I spoke too soon, BTC bounced off of 9k very nicely and is now headed to test the previous trendline.
Note
Looks like we have a short term breakout which could get us up above our first and preferred trend line. This could get us back to the 9600 range and help us retest 10k.
Note
So that Symmetrical Triangle has morphed into an Ascending Triangle. This looks like we could break out from it with in the next few hours and head back up to 9,600.
Note
Hey Guys, Sorry I've been away and not able to update in such a critical time, My fiance's grandfather passed away and it's like 3 months to our wedding so needless to say theres a lot been going on, and I've not been availible.
Here is what I'm seeing on the horizon, Since BTC failed at the psycological 10K level we've been in a correction, you can see the head and shoulders that formed between our two supporting upward trendlines that sent us lower. I think the correction will take us to a retest of the 8k level reaching the target of the Head and Shoulders. We will reevaluate then, but I think thats where we turn around considering the Blockchain conferences and all of the hype surrounding the potential of 2019.
Note
Note
Note
I extended the c wave out to the bottom of the bounce zone because it lines up better with the 1.68 fib extension of the A leg. So far it loos like we have perfectly completed our B and the Ascending wedge, the one I talked about in my ETH Post in reference to BTC, has broken down. IF we go higher from here dont get exited as I see a potentential head and shoulders forming. IF we go down which is what I expect, I would expect onsolidation around 8k and a target right above 7K give or take 200
Note
... along with that, this head and shoulders that has formed has a target that would send us just below the red bounce target, further proving our direction.
Note
Here it is, a clear view. A fractal Decending Wedge, and bullish divergence on the MACD this puppy is getting prepared to turn around and head upward. We'll look for another small drop to bounce off of the lower bound once more before breaking out to move up. We shall watch and see.
Note
this could be a break from the Decending Wedge. Waiting for confirmation.
Note
Retraced and bounce perfectly at the C leg, that level lines up with the top of our diamond bottom pattern. We could see a retest of 7k which is the upward sloping lower bound og the symmetrical triangle and another huge support, but we could also bounce here and climb for a potential breakout of the decending wedge.
Like it if you like it, and comment if you have a question. I'm happy to answer!
***This is a reflection of my own educated opinion and should not be viewed as financial advise, please use this for educational purposes only.***
***This is a reflection of my own educated opinion and should not be viewed as financial advise, please use this for educational purposes only.***
Related publications
Disclaimer
The information and publications are not meant to be, and do not constitute, financial, investment, trading, or other types of advice or recommendations supplied or endorsed by TradingView. Read more in the Terms of Use.