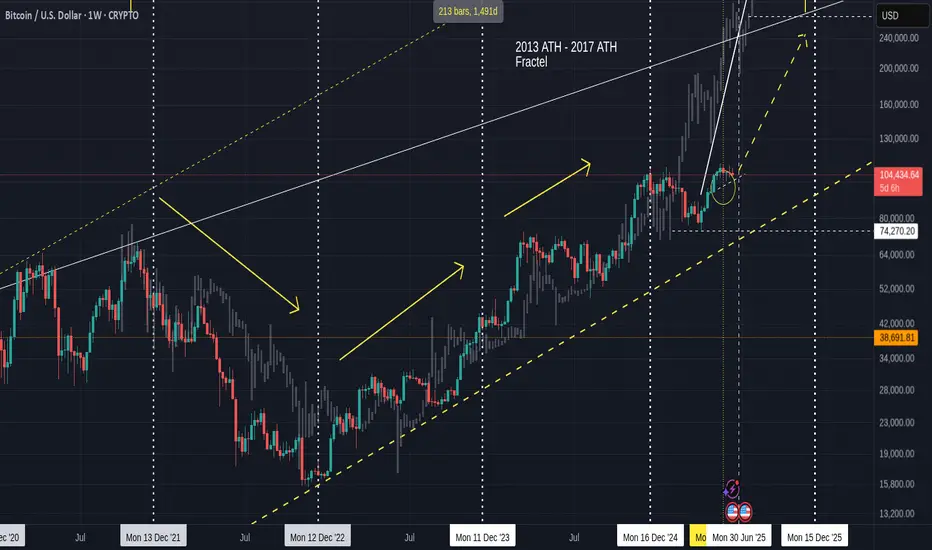
This is the old fractal chart and I have faded out the Fractal from 2013 to 2017,
Everything ese remains unchanged since Feb this year.
We hit the expected price range indicated by the circle and we are still in that area but I expect, once the month closes and we have a small red month candle, then we can start printing Green again.
The daily version of this chart shows us more local detail
https://tradingview.sweetlogin.com/x/7LXBOC7r/
We have left the area of resistance and so now, we have a free move BUT I think we may dip down to that line of support around 100K - 98K
This would not be a bad thing to do before the end of the month as it would cool off the PA / RSI and MACD and so give confidence to the serious investor while scaring the pats off the New guys and Gals.
The Daily MACD still has a way to dip before it may find support on the neutral line
https://tradingview.sweetlogin.com/x/ylFLOgGW/
This level could see PA near that line of support but it is possible for MACD to drop while PA ranges.
So we could see that Dip to line of support and it may offer the last 100K buying zone for a very long time ..
But we do have Stupid people trying to start WW3 with Lies and Greed - this could possibly destabilise things.
Be Cautious
Disclaimer
The information and publications are not meant to be, and do not constitute, financial, investment, trading, or other types of advice or recommendations supplied or endorsed by TradingView. Read more in the Terms of Use.
Disclaimer
The information and publications are not meant to be, and do not constitute, financial, investment, trading, or other types of advice or recommendations supplied or endorsed by TradingView. Read more in the Terms of Use.