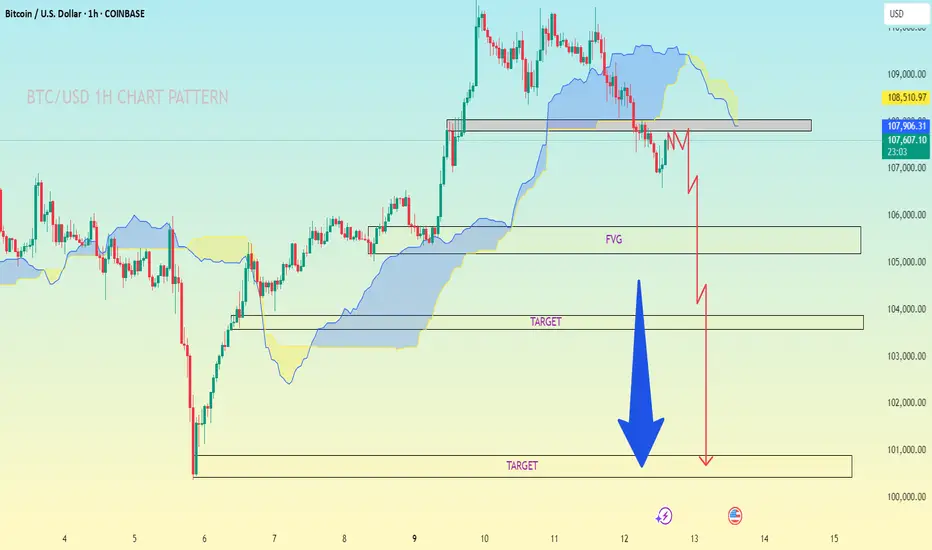
BTC/USD 1-hour chart, we can see that MY continuing a bearish price projection, and the chart has clearly defined target zones based on structure and Ichimoku analysis.
🔍 Key Observations:
Price is currently below the Ichimoku cloud, confirming a bearish bias.
A resistance retest has already occurred.
Price action suggests a clear break of structure, aiming lower.
Two horizontal target zones are marked below with a sharp projected drop (red path) and a blue downward arrow for emphasis.
---
🎯 Bearish Target Levels:
1. First Target: Around $104,000
This is your immediate bearish target.
Aligned with minor historical support and possible reaction area.
2. Final Target: Around $100,000–$101,000
This is the extended target and marked clearly on the chart with a bold arrow.
Likely represents a psychological level and strong liquidity zone.
---
✅ Conclusion:
Short-term bear bias remains strong unless the price reclaims and closes above the resistance/cloud zone (~$108,500).
Watch for potential reactions at $104K; if it breaks cleanly, $100K–$101K becomes highly probable.
Let me know if you want support/resistance zones or confirmations using volume or Fibonacci confluence.
Trade active
trade activeNote
sell running 400 pipst.me/forexofdollarsmagnet
Forex, gold and crypto signal's with detailed analysis & get consistent results..
t.me/Jhonscalpertrade11
Gold signal's with proper TP & SL for high profits opportunities..
Forex, gold and crypto signal's with detailed analysis & get consistent results..
t.me/Jhonscalpertrade11
Gold signal's with proper TP & SL for high profits opportunities..
Related publications
Disclaimer
The information and publications are not meant to be, and do not constitute, financial, investment, trading, or other types of advice or recommendations supplied or endorsed by TradingView. Read more in the Terms of Use.
t.me/forexofdollarsmagnet
Forex, gold and crypto signal's with detailed analysis & get consistent results..
t.me/Jhonscalpertrade11
Gold signal's with proper TP & SL for high profits opportunities..
Forex, gold and crypto signal's with detailed analysis & get consistent results..
t.me/Jhonscalpertrade11
Gold signal's with proper TP & SL for high profits opportunities..
Related publications
Disclaimer
The information and publications are not meant to be, and do not constitute, financial, investment, trading, or other types of advice or recommendations supplied or endorsed by TradingView. Read more in the Terms of Use.