Analysis BTC/USD Daily Chart
**Chart Overview (Daily Timeframe)**
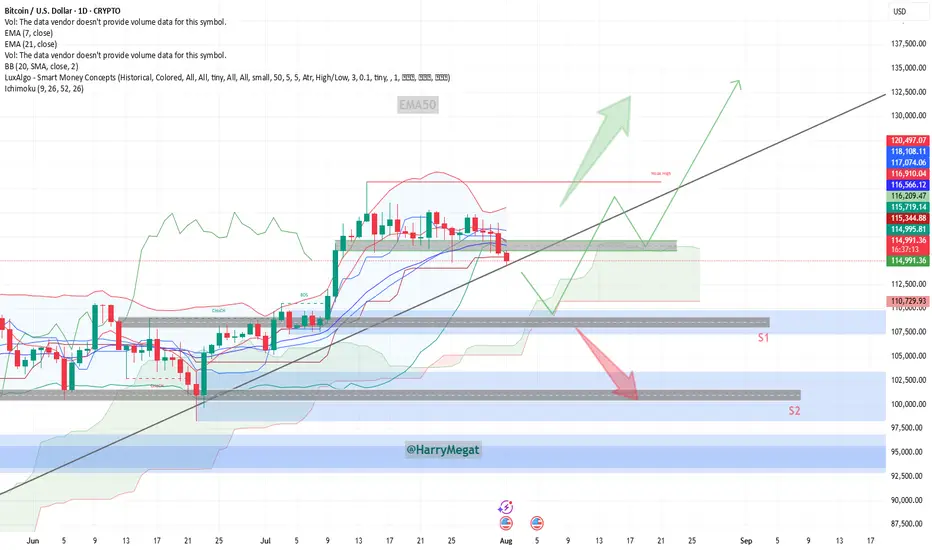
**Current Price**: \~\$114,937
**EMA 7**: \$116,896 (short-term)
**EMA 21**: \$116,561 (medium-term)
**Trendline**: Price is testing the long-term ascending trendline
**Key Zones:**
* **Support 1 (S1)**: \~\$110,000
* **Support 2 (S2)**: \~\$102,000
* **Immediate Resistance Zone**: \~\$116,000–\$120,000
**Bullish Scenario**
**Conditions**:
* Price **holds above the ascending trendline**
* A strong **bounce from current level (\~\$115K)** or a reclaim above **\$116K**
**Buy Setup**:
* **Entry**: \$115,000–\$116,000 (if bounce confirmed)
* **Stop-loss**: Below \$114,000 or the ascending trendline
* **Targets**:
* TP1: \$120,000
* TP2: \$125,000
* TP3: \$132,000+
**Confirmation**:
* Bullish candle formation near the trendline
* Reclaim of EMAs (especially EMA 7)
**Bearish Scenario**
**Conditions**:
* Price **breaks below the ascending trendline** and **closes below \$114K**
* Rejection from \$116K zone with a strong red candle
**Sell Setup**:
* **Entry**: Below \$114,000 (on confirmed breakdown)
* **Stop-loss**: Above \$116,000
* **Targets**:
* TP1: \$110,000 (S1)
* TP2: \$105,000
* TP3: \$102,000 (S2)
**Invalidation**:
* Quick recovery above \$114.5K and trendline reclaim = possible fakeout
**Bias**
**Neutral to Bullish**, as price is **at trendline support**.
Watch closely for **price reaction at current levels** for the next directional trade.

**Chart Overview (Daily Timeframe)**
**Current Price**: \~\$114,937
**EMA 7**: \$116,896 (short-term)
**EMA 21**: \$116,561 (medium-term)
**Trendline**: Price is testing the long-term ascending trendline
**Key Zones:**
* **Support 1 (S1)**: \~\$110,000
* **Support 2 (S2)**: \~\$102,000
* **Immediate Resistance Zone**: \~\$116,000–\$120,000
**Bullish Scenario**
**Conditions**:
* Price **holds above the ascending trendline**
* A strong **bounce from current level (\~\$115K)** or a reclaim above **\$116K**
**Buy Setup**:
* **Entry**: \$115,000–\$116,000 (if bounce confirmed)
* **Stop-loss**: Below \$114,000 or the ascending trendline
* **Targets**:
* TP1: \$120,000
* TP2: \$125,000
* TP3: \$132,000+
**Confirmation**:
* Bullish candle formation near the trendline
* Reclaim of EMAs (especially EMA 7)
**Bearish Scenario**
**Conditions**:
* Price **breaks below the ascending trendline** and **closes below \$114K**
* Rejection from \$116K zone with a strong red candle
**Sell Setup**:
* **Entry**: Below \$114,000 (on confirmed breakdown)
* **Stop-loss**: Above \$116,000
* **Targets**:
* TP1: \$110,000 (S1)
* TP2: \$105,000
* TP3: \$102,000 (S2)
**Invalidation**:
* Quick recovery above \$114.5K and trendline reclaim = possible fakeout
**Bias**
**Neutral to Bullish**, as price is **at trendline support**.
Watch closely for **price reaction at current levels** for the next directional trade.
Disclaimer
The information and publications are not meant to be, and do not constitute, financial, investment, trading, or other types of advice or recommendations supplied or endorsed by TradingView. Read more in the Terms of Use.
Disclaimer
The information and publications are not meant to be, and do not constitute, financial, investment, trading, or other types of advice or recommendations supplied or endorsed by TradingView. Read more in the Terms of Use.