Hello, dear friends!♥️
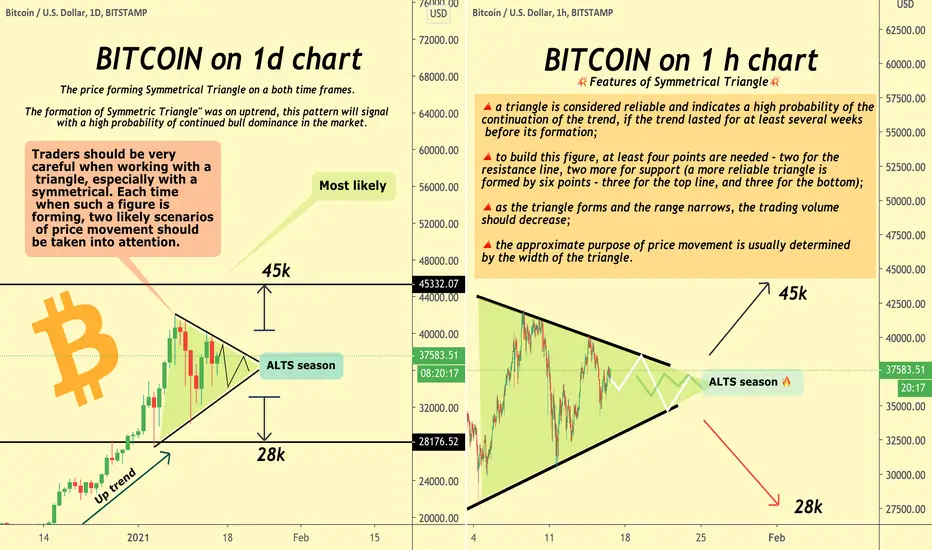
Bitcoin's price movement forms a symmetrical triangle. We can see it on two timeframes - on the daily (left) and hourly (right).

We know, that symmetrical triangle is a figure of uncertainty, that's why it's very dangerous. Especially when the price of Bitcoin is very high.
But knowing certain rules, we'll be able to assess the side of the price movement with a higher probability.
🔺a triangle is considered reliable and indicates a high probability of the continuation of the trend, if the trend lasted for at least several weeks before its formation;
🔺to build this figure, at least four points are needed - two for the resistance line, two more for support (a more reliable triangle is formed by six points - three for the top line, and three for the bottom);
🔺as the triangle forms and the range narrows, the trading volume should decrease;
🔺the approximate purpose of price movement is usually determined by the width of the triangle.
📌Traders should be very careful when working with a triangle, especially with a symmetrical. Each time when such a figure is forming, two likely scenarios of price movement should be taken into attention.
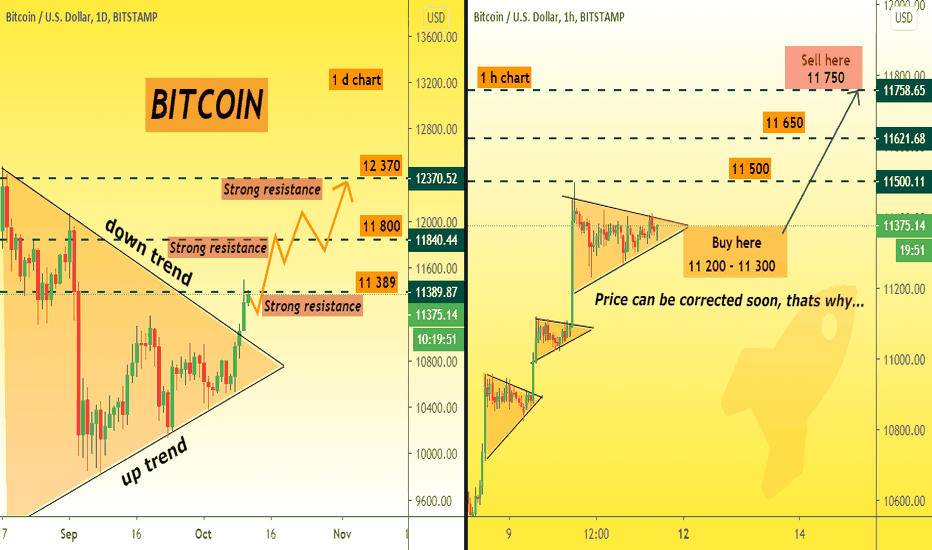
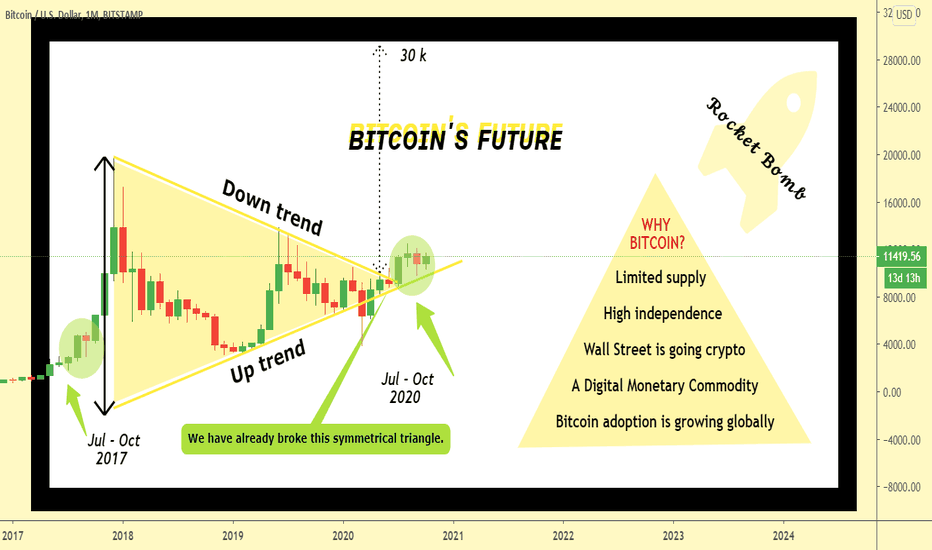
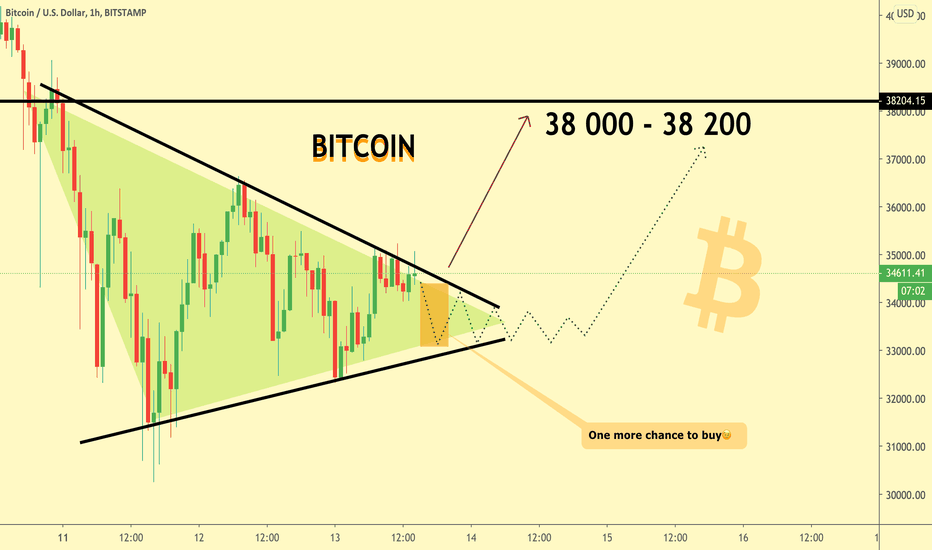
Let's take a look how it worked on previous analysis 🧐
Stay safe and optimistic🙏🏻
I try to be useful to You🧡
Always sincerely with You😊
Your Rocket Bomb🚀💣
Bitcoin's price movement forms a symmetrical triangle. We can see it on two timeframes - on the daily (left) and hourly (right).
We know, that symmetrical triangle is a figure of uncertainty, that's why it's very dangerous. Especially when the price of Bitcoin is very high.
But knowing certain rules, we'll be able to assess the side of the price movement with a higher probability.
🔺a triangle is considered reliable and indicates a high probability of the continuation of the trend, if the trend lasted for at least several weeks before its formation;
🔺to build this figure, at least four points are needed - two for the resistance line, two more for support (a more reliable triangle is formed by six points - three for the top line, and three for the bottom);
🔺as the triangle forms and the range narrows, the trading volume should decrease;
🔺the approximate purpose of price movement is usually determined by the width of the triangle.
📌Traders should be very careful when working with a triangle, especially with a symmetrical. Each time when such a figure is forming, two likely scenarios of price movement should be taken into attention.
Let's take a look how it worked on previous analysis 🧐
Stay safe and optimistic🙏🏻
I try to be useful to You🧡
Always sincerely with You😊
Your Rocket Bomb🚀💣
Note
CAREFULLY READ THIS UPDATE!!!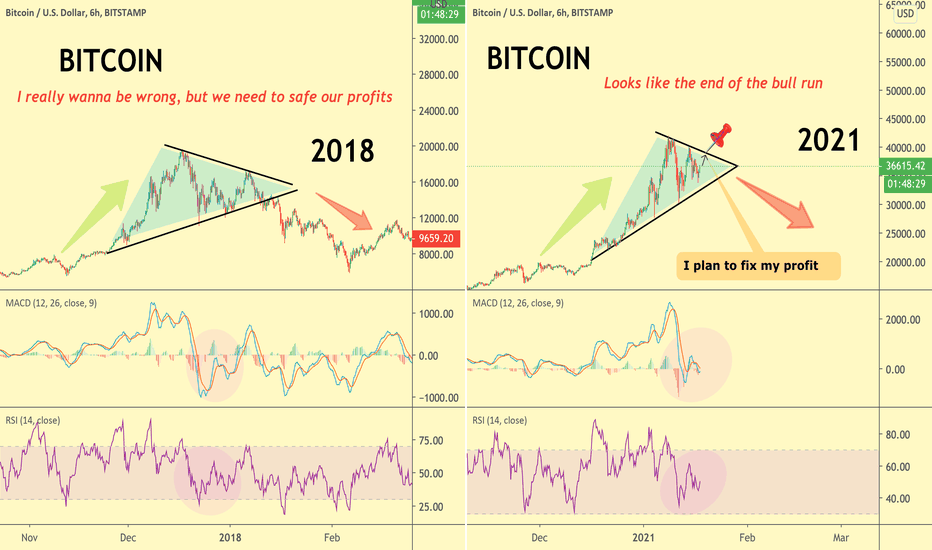
Disclaimer
The information and publications are not meant to be, and do not constitute, financial, investment, trading, or other types of advice or recommendations supplied or endorsed by TradingView. Read more in the Terms of Use.
Disclaimer
The information and publications are not meant to be, and do not constitute, financial, investment, trading, or other types of advice or recommendations supplied or endorsed by TradingView. Read more in the Terms of Use.