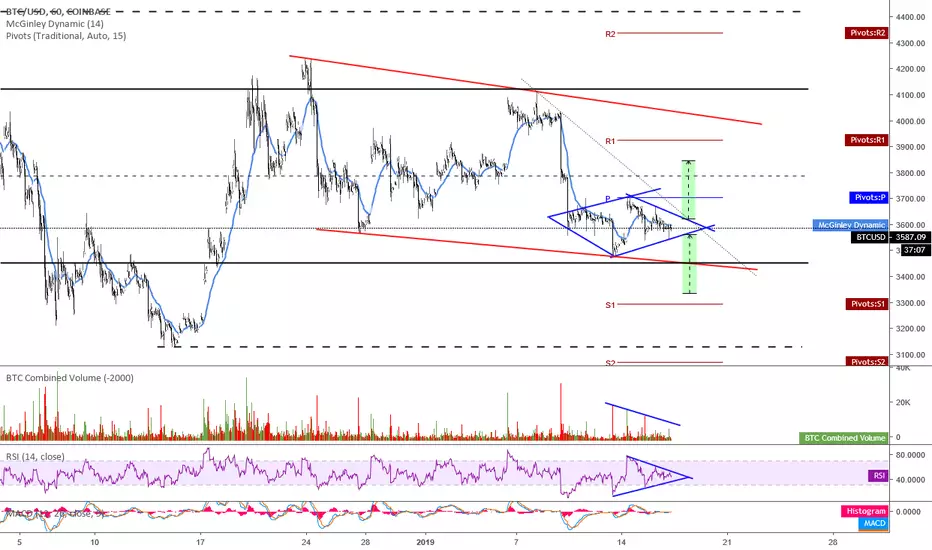
Good morning, traders. Yesterday we took a look at the larger TF and today we will check out what the smaller TF is saying on the Coinbase chart. I have outlined the black TR, red possible flag, and the blue diamond that is currently printing.
We can see that price is nearing a decision point. Does it go up or down? Price is at the bottom of the TR and possible flag, suggesting support will give it a bounce. It is also printing a diamond. The breakout targets based on the diamond are shown in both directions with my belief being that price will target the S1 pivot if dropping and the R1 pivot if rising. Furthermore, targeting the R1 pivot should have price ultimately targeting the upper red resistance and, if this happens, then there is a lot more reason to believe price will push through it and head up to those higher targets that have been in play for 3-4 weeks now. However, if price heads down then it will break that flag and likely retest the 2018 lows. It doesn't have to, and we could realistically see a bounce from the S1 area, but with a move down like that it seems more likely to retest those lows.
RSI and MACD are printing their own triangles in unison with price's diamond. We can also see volume dropping off pretty well over the past four days. With the price, RSI, and MACD consolidations occurring, a strong breakout is imminent and traders would likely do themselves a favor by waiting for confirmation of direction before entering a trade.
As I have continued to warn traders, we need to see volume increasing as price increases to provide the fuel needed to push through that nearby overhead resistance. Failure to do so means price is most likely headed down. However, down may not be bad. If there is a move down from here to the ~$2900 target, then it could very well just be a Spring which would indicate bullish momentum incoming and we could expect a very nice move up. However, we would have to wait until that point and evaluate price action and volume at that time.
Every day, we have a choice to act positively or negatively, so if you get a chance, do something decent for someone today which could be as simple as sharing a nice word with them. You just might change their day, or even their life.
Remember, you can always click on the "share" button in the lower right hand of the screen, under the chart, and then click on "Make it mine" from the popup menu in order to get a live version of the chart that you can explore on your own.
Related publications
Disclaimer
The information and publications are not meant to be, and do not constitute, financial, investment, trading, or other types of advice or recommendations supplied or endorsed by TradingView. Read more in the Terms of Use.
Related publications
Disclaimer
The information and publications are not meant to be, and do not constitute, financial, investment, trading, or other types of advice or recommendations supplied or endorsed by TradingView. Read more in the Terms of Use.