Market in the last 24hrs
BTCUSD had picked up a bit of steam in the last 24 hours. However, the it was still struggling to breakout above the upper band of the Bollinger bands.
Today’s Trend analysis
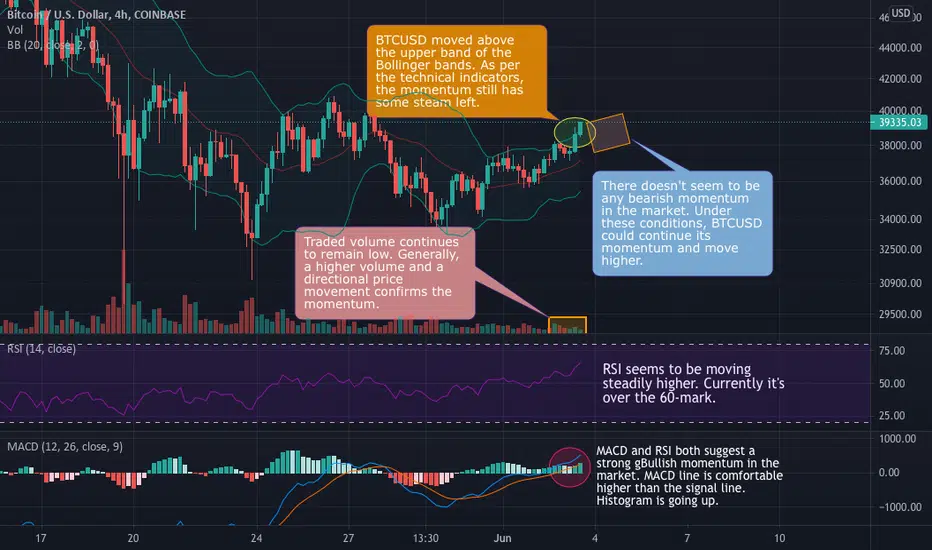
BTCUSD has broken above the upper band of the Bollinger bands now. The momentum in the market seems steady on the upside now.
Price volatility remained moderate at approximately 4.2%, with the day's range between $37,184.88— $39,216.89.
Price at the time of publishing: $39,162.04
BTC's market cap: $733.01 Billion
Indicator summary is giving a 'BUY' signal on BTCUSD .
Out of 11 Oscillator indicators, 9 are neutral and 2 are giving a BUY signal on bitcoin.
Out of 15 Moving average indicators, 11 are giving a BUY signal.
Apart from the above 4H chart, the 1H timeframe shows a wonderful channel pattern. It could be used to enter into short term trades on BTCUSD.

Volumes have remained low in the past 24 hours.
----------------------------------------------------------------------------------------
The analysis is based on signals from 26 technical indicators, out of which 15 are moving averages and the remaining 11 are oscillators. These indicator values are calculated using 4Hr candles.
Note: Above analysis would hold true if we do not encounter a sudden jump in trade volume .
----------------------------------------------------------------------------------------
Any feedback and suggestions would help in further improving the analysis!
BTCUSD had picked up a bit of steam in the last 24 hours. However, the it was still struggling to breakout above the upper band of the Bollinger bands.
Today’s Trend analysis
BTCUSD has broken above the upper band of the Bollinger bands now. The momentum in the market seems steady on the upside now.
Price volatility remained moderate at approximately 4.2%, with the day's range between $37,184.88— $39,216.89.
Price at the time of publishing: $39,162.04
BTC's market cap: $733.01 Billion
Indicator summary is giving a 'BUY' signal on BTCUSD .
Out of 11 Oscillator indicators, 9 are neutral and 2 are giving a BUY signal on bitcoin.
Out of 15 Moving average indicators, 11 are giving a BUY signal.
Apart from the above 4H chart, the 1H timeframe shows a wonderful channel pattern. It could be used to enter into short term trades on BTCUSD.
Volumes have remained low in the past 24 hours.
----------------------------------------------------------------------------------------
The analysis is based on signals from 26 technical indicators, out of which 15 are moving averages and the remaining 11 are oscillators. These indicator values are calculated using 4Hr candles.
Note: Above analysis would hold true if we do not encounter a sudden jump in trade volume .
----------------------------------------------------------------------------------------
Any feedback and suggestions would help in further improving the analysis!
Disclaimer
The information and publications are not meant to be, and do not constitute, financial, investment, trading, or other types of advice or recommendations supplied or endorsed by TradingView. Read more in the Terms of Use.
Disclaimer
The information and publications are not meant to be, and do not constitute, financial, investment, trading, or other types of advice or recommendations supplied or endorsed by TradingView. Read more in the Terms of Use.