Bitcoin show us a strenghten in the price. So, I will follow this updtrend by H4 and H1 timeframe.

Following the H4 timeframe. I see that Bitcoin will going to the bull rally. So, I'm in long and vote for bullish.
Also, for reference, I fount out a Shoulder Head Shoulder Inverted in Daily timeframe. And that could be a bullish signal in the Bitcoin price.
Following the H4 timeframe. I see that Bitcoin will going to the bull rally. So, I'm in long and vote for bullish.
Also, for reference, I fount out a Shoulder Head Shoulder Inverted in Daily timeframe. And that could be a bullish signal in the Bitcoin price.
Note
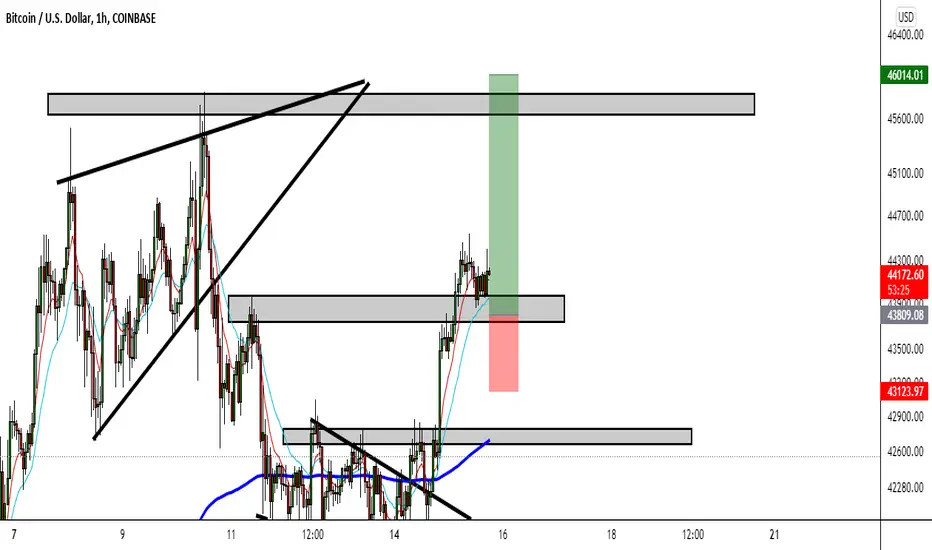
In this H4 timeframe, I see that Bitcoin forming some weak in the price and this could be that we could to look a little drop of 2% that will goes to $42,700 USD approx.
But if you look in H1, I see the following. I see a bearish divergence in the RSI, and also ad bearish engulfing pattern in the price action and those red candlestick that forming previously it's a three bearish man pattern, but psycologically it's bearish pattern with chance to find a downside.
And fake broke up in the H1 timeframe. Well, I will hope in H4 timeframe that Bitcoin hit down the 42700 USD. Because in that zone could be good zone to buy.
Trade closed manually
Closed up manually this idea and cancelled!!!Note
We're going to find down best buy zoneDisclaimer
The information and publications are not meant to be, and do not constitute, financial, investment, trading, or other types of advice or recommendations supplied or endorsed by TradingView. Read more in the Terms of Use.
Disclaimer
The information and publications are not meant to be, and do not constitute, financial, investment, trading, or other types of advice or recommendations supplied or endorsed by TradingView. Read more in the Terms of Use.