BTC‑USD | 2‑Week Chart – Quick Read
Structure & Trendlines
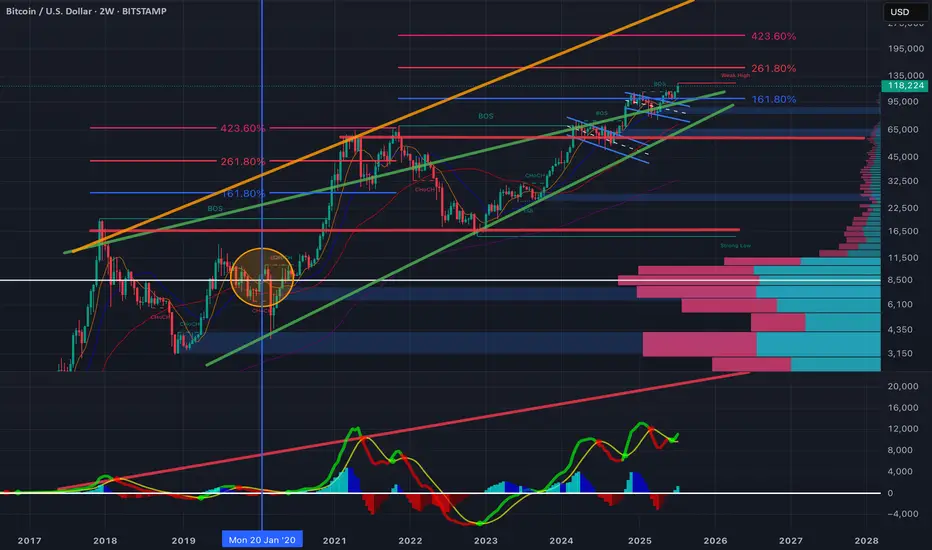
* Price continues to respect the 2019‑2025 rising green channel and has flipped the 2017‑2021 orange trendline from resistance to support.
* A fresh break‑of‑structure above the 2021 ATH confirms continuation. Invalidation sits near the channel base / 65‑70 k demand zone.
Fib Road‑Map
* 1.618 extension (\~90 k) was reclaimed and back‑tested.
* Next confluence levels are the 2.618 (\~180 k) and 4.236 (\~240 k) extensions, matching thin volume nodes on the VPVR.
Momentum
* Multi‑time‑frame RSIs have broken their downtrends and pushed firmly bullish, echoing the 2020 breakout posture.
* The 2‑week MACD histogram has flipped positive with a higher‑low signal—momentum rebuilding.
Volume Profile
* Highest historical volume sits 15‑35 k; above 120 k liquidity thins sharply until ~160 k.
Near‑term downside risk
* The last episode of aggressive Fed rate cuts (March 2020) triggered a sharp washout before the subsequent melt‑up.
* Cuts keep getting deferred because unemployment remains low and jobs data solid; if a sudden pivot arrives on weakening data, a risk‑off flush toward the mid‑channel zone (≈ 80‑90 k) is possible before higher targets re‑engage.
Macro uptrend intact; pullbacks to the channel centre are buy‑the‑dip territory while momentum and structure favour an eventual 161.8 → 261.8 push, but stay nimble for policy‑driven volatility.
Structure & Trendlines
* Price continues to respect the 2019‑2025 rising green channel and has flipped the 2017‑2021 orange trendline from resistance to support.
* A fresh break‑of‑structure above the 2021 ATH confirms continuation. Invalidation sits near the channel base / 65‑70 k demand zone.
Fib Road‑Map
* 1.618 extension (\~90 k) was reclaimed and back‑tested.
* Next confluence levels are the 2.618 (\~180 k) and 4.236 (\~240 k) extensions, matching thin volume nodes on the VPVR.
Momentum
* Multi‑time‑frame RSIs have broken their downtrends and pushed firmly bullish, echoing the 2020 breakout posture.
* The 2‑week MACD histogram has flipped positive with a higher‑low signal—momentum rebuilding.
Volume Profile
* Highest historical volume sits 15‑35 k; above 120 k liquidity thins sharply until ~160 k.
Near‑term downside risk
* The last episode of aggressive Fed rate cuts (March 2020) triggered a sharp washout before the subsequent melt‑up.
* Cuts keep getting deferred because unemployment remains low and jobs data solid; if a sudden pivot arrives on weakening data, a risk‑off flush toward the mid‑channel zone (≈ 80‑90 k) is possible before higher targets re‑engage.
Macro uptrend intact; pullbacks to the channel centre are buy‑the‑dip territory while momentum and structure favour an eventual 161.8 → 261.8 push, but stay nimble for policy‑driven volatility.
Disclaimer
The information and publications are not meant to be, and do not constitute, financial, investment, trading, or other types of advice or recommendations supplied or endorsed by TradingView. Read more in the Terms of Use.
Disclaimer
The information and publications are not meant to be, and do not constitute, financial, investment, trading, or other types of advice or recommendations supplied or endorsed by TradingView. Read more in the Terms of Use.