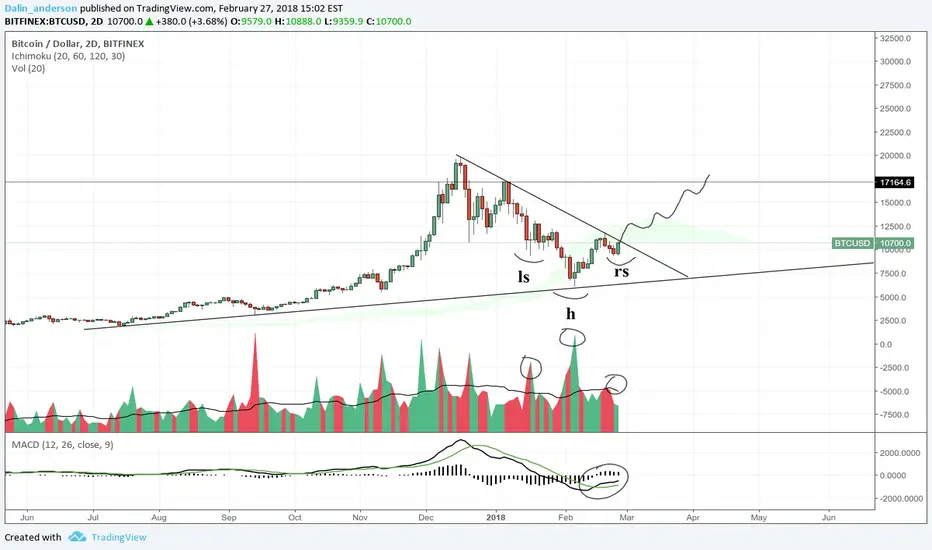
Watching for resistance to break but we have a very clear bullish shift in momentum and a HUGE bullish reversal pattern with sufficient volume for a breakout .
I have been laddering in since 10,000$ - 8,000$ 7,000$ 6,000$ Now I plan to ride this impulsive wave on the upside to new all time highs in 2018
also Technical analysis predicted this move long before the GOLDMEN SACHS news announcement
Hope you don't have any short potions on unless you have some good stop-losses in place
I am treating this market as bullish because the trending support line from $1,800 to $3,000 to $6,000 is a strong support trend & has successfully bounced 3 times now.
enjoy the profits we can all expect if this breaks major downtrend resistance like it looks like its going to
don't get greedy in the next wave up be willing to take profits into USDT and stay profitable out there!!.
Note
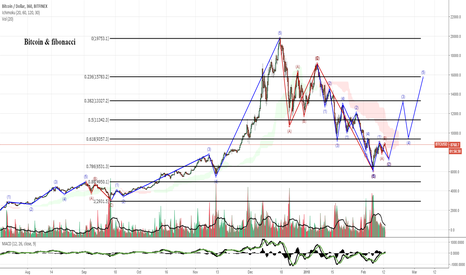

the other recent bitcoin charts I made__
Note
Note
Disclaimer
The information and publications are not meant to be, and do not constitute, financial, investment, trading, or other types of advice or recommendations supplied or endorsed by TradingView. Read more in the Terms of Use.
Disclaimer
The information and publications are not meant to be, and do not constitute, financial, investment, trading, or other types of advice or recommendations supplied or endorsed by TradingView. Read more in the Terms of Use.