⚠️ Disruption Analysis – BTC/USD
1. Questionable Bullish Bias
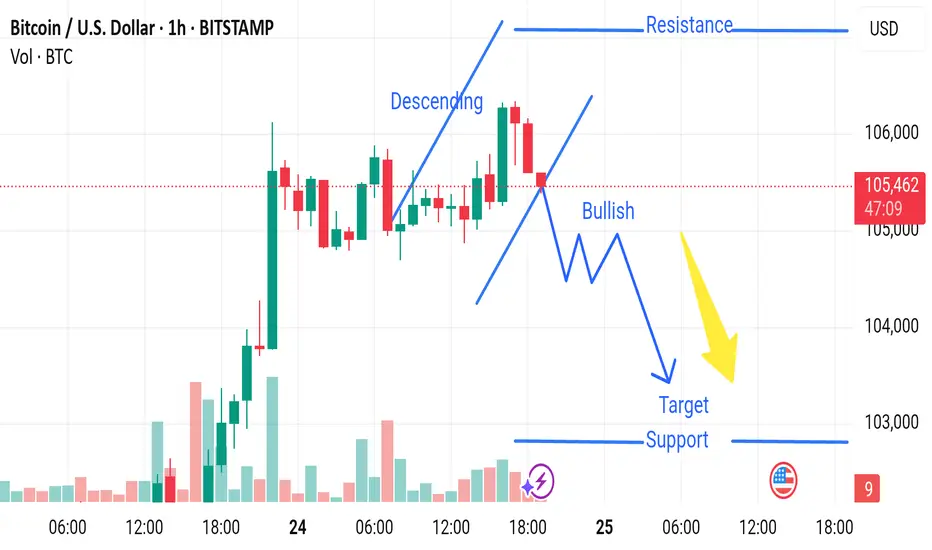
The chart labels the structure as "Bullish," but the current setup looks more like a potential distribution phase than a healthy continuation pattern.
The price is moving sideways with declining volume, suggesting buyers are losing strength.
2. Volume Discrepancy
Notice the spike in volume during the sharp move up, followed by flat candles and lower volume.
This is typical of a "pump and fade" structure, where large players exit after a rapid price move, leaving retail traders with poor entries.
3. Resistance Not Clearly Broken
Price failed to sustain above 105,800–106,000, indicating that the resistance zone remains valid.
The recent rejection candles near this level suggest sellers are active and overhead pressure is strong.
4. Descending Into Compression
The blue "descending" structure before the sideways move may signal a bearish flag or a pause before further downside—not necessarily a bullish sign.
5. False Reversal Warning
The bullish pattern drawn with zig-zags (implying consolidation before continuation) could actually be setting up a bull trap.
If price fakes a bounce and then breaks below 104,800, a sharper decline toward the 103,000 target could accelerate quickly.
1. Questionable Bullish Bias
The chart labels the structure as "Bullish," but the current setup looks more like a potential distribution phase than a healthy continuation pattern.
The price is moving sideways with declining volume, suggesting buyers are losing strength.
2. Volume Discrepancy
Notice the spike in volume during the sharp move up, followed by flat candles and lower volume.
This is typical of a "pump and fade" structure, where large players exit after a rapid price move, leaving retail traders with poor entries.
3. Resistance Not Clearly Broken
Price failed to sustain above 105,800–106,000, indicating that the resistance zone remains valid.
The recent rejection candles near this level suggest sellers are active and overhead pressure is strong.
4. Descending Into Compression
The blue "descending" structure before the sideways move may signal a bearish flag or a pause before further downside—not necessarily a bullish sign.
5. False Reversal Warning
The bullish pattern drawn with zig-zags (implying consolidation before continuation) could actually be setting up a bull trap.
If price fakes a bounce and then breaks below 104,800, a sharper decline toward the 103,000 target could accelerate quickly.
Disclaimer
The information and publications are not meant to be, and do not constitute, financial, investment, trading, or other types of advice or recommendations supplied or endorsed by TradingView. Read more in the Terms of Use.
Disclaimer
The information and publications are not meant to be, and do not constitute, financial, investment, trading, or other types of advice or recommendations supplied or endorsed by TradingView. Read more in the Terms of Use.