BTC/USD
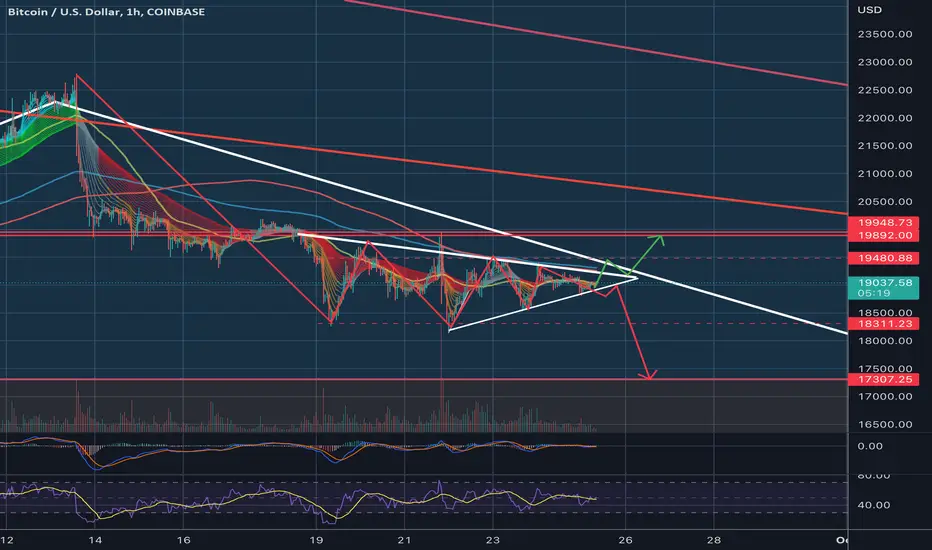
Bullish Case
- Break out above $19.4k
- Daily MACD and Histogram reversing
- Symmetrical Triangle, 20% chance breaking upside
Bearish Case
- Heavy resistance zone at $19.4k which was once support
- CME close of $18.75k
- Symmetrical triangle in a downtrend tends to be a continuation patter.Strong Support at the $45 level shown by the Volume Profile
I am more bearish than bullish, thoughts?
Disclaimer
The information and publications are not meant to be, and do not constitute, financial, investment, trading, or other types of advice or recommendations supplied or endorsed by TradingView. Read more in the Terms of Use.
Disclaimer
The information and publications are not meant to be, and do not constitute, financial, investment, trading, or other types of advice or recommendations supplied or endorsed by TradingView. Read more in the Terms of Use.