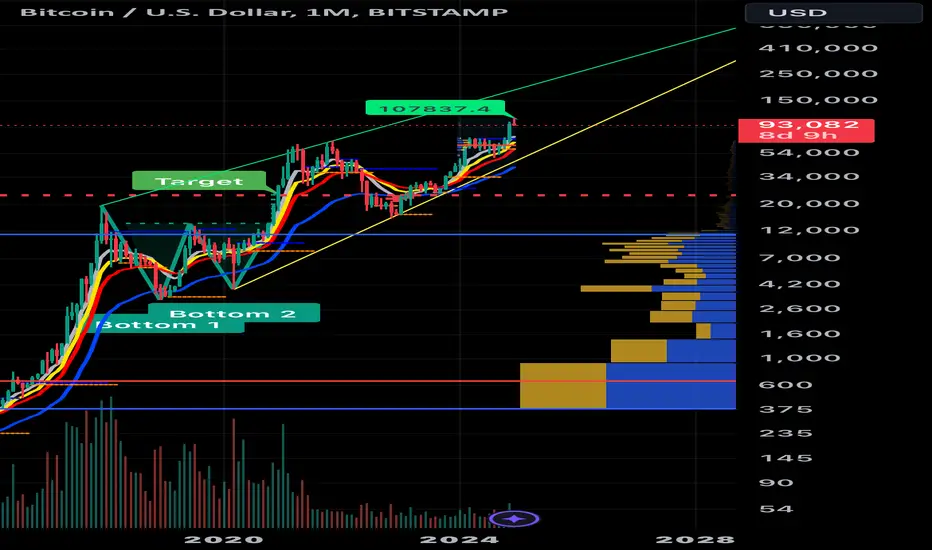
The BTC/USD monthly chart does appear to be forming a rising wedge pattern, which is often considered a bearish reversal signal.
What is a Rising Wedge?
A rising wedge is a chart pattern characterized by two converging lines, with the upper line sloping upwards more steeply than the lower line.
This pattern suggests that buying pressure is weakening, and sellers are gaining control.
A breakout below the lower trendline of the wedge is typically considered a bearish signal, potentially indicating a significant price decline.
Potential Implications:
Market Top: If the rising wedge pattern plays out as expected, it could signal the end of the current uptrend and a potential market top.
Price Correction: A breakout below the lower trendline could lead to a significant price correction, potentially wiping out a portion of recent gains.
Black Swan Events:
Unpredictable Nature: Black swan events are highly improbable and unexpected events that have a significant impact on the market.
Potential Impact: A positive black swan event, such as a major regulatory approval or a significant technological breakthrough, could potentially reverse the bearish trend and propel Bitcoin prices higher.
Important Considerations:
Chart Patterns are not Deterministic: Chart patterns are not foolproof predictions. They provide insights into potential market movements but should not be relied upon solely for investment decisions.
Fundamental Analysis: It's crucial to consider fundamental factors, such as economic conditions, regulatory developments, and investor sentiment, alongside technical analysis.
USDT: 0xd3787d843Cf915E5475119459B34b6429827c297
Disclaimer
The information and publications are not meant to be, and do not constitute, financial, investment, trading, or other types of advice or recommendations supplied or endorsed by TradingView. Read more in the Terms of Use.
USDT: 0xd3787d843Cf915E5475119459B34b6429827c297
Disclaimer
The information and publications are not meant to be, and do not constitute, financial, investment, trading, or other types of advice or recommendations supplied or endorsed by TradingView. Read more in the Terms of Use.