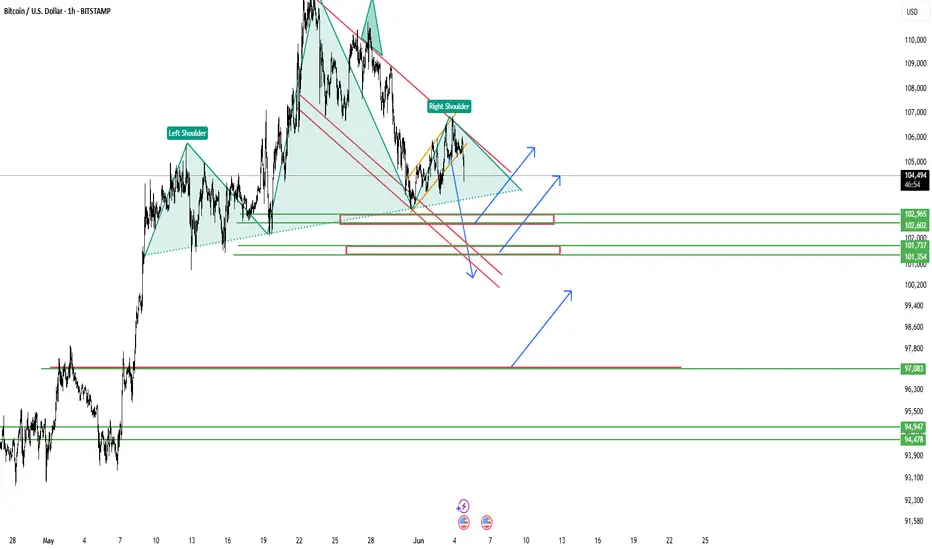
This chart illustrates a potential Head and Shoulders pattern, signaling a possible trend reversal on the 1H Bitcoin/USD timeframe. The price is currently compressing within a falling wedge, and the right shoulder has recently completed.
Key highlights:
Head & Shoulders pattern: Suggests a bearish reversal if neckline breaks.
Price inside falling wedge: Could act as a short-term consolidation structure before a breakout.
Demand zones:
102,965 – 102,602
107,000 – 101,737
97,350 – 97,083
Scenarios:
Bullish breakout of the wedge may invalidate the head & shoulders and trigger upside continuation.
Bearish breakdown below neckline and demand zones could open deeper retracements.
This setup offers a clear "wait-for-confirmation" strategy before entering long or short, based on price reaction at key levels.
If this Head & Shoulders plays out... oh boy 😏
We’re diving straight into those demand zones.
Next stops?
🔻 102,600
🔻 101,700
🔻 97,000 (ultimate trap zone)
But hey — break the wedge to the upside and bulls might flip the script.
Let’s see who wins 🔥📉📈
#Bitcoin #BTC #HeadAndShoulders #CryptoAnalysis
Markets move in angles. I follow the lines.
Disclaimer
The information and publications are not meant to be, and do not constitute, financial, investment, trading, or other types of advice or recommendations supplied or endorsed by TradingView. Read more in the Terms of Use.
Markets move in angles. I follow the lines.
Disclaimer
The information and publications are not meant to be, and do not constitute, financial, investment, trading, or other types of advice or recommendations supplied or endorsed by TradingView. Read more in the Terms of Use.