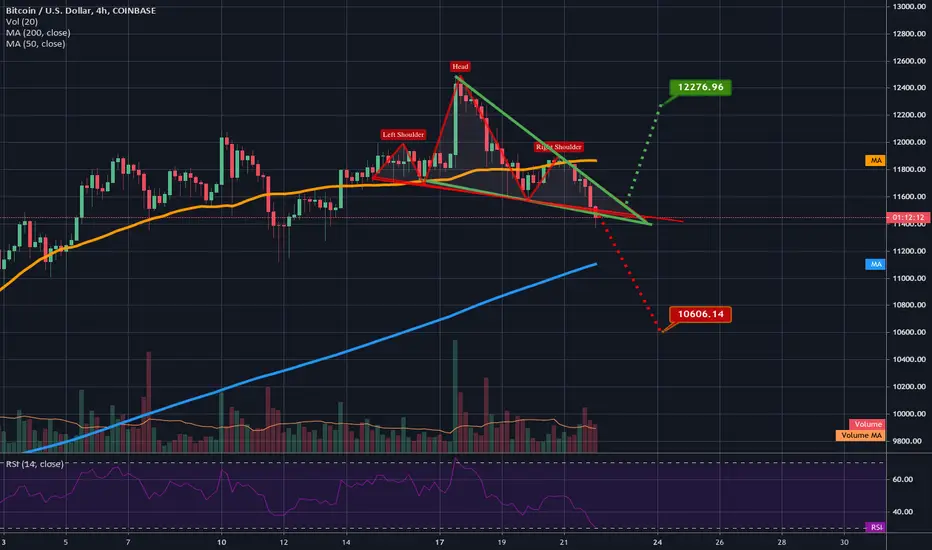
Always a common sight seeing these two patterns attached at the hip. This time it's a pretty even toss up as to which pattern is going to trigger. We are currently teasing a breakdown with a candle currently below the neckline but volume has yet to confirm and we can see the 4hr rsi is nearing the oversold zone. It's a 50/50 chance on which one triggers so our next stop is either 10.6k or 12.3k
Note
the head and shoulders pattern is still valid on the 4hr chart and price action is currently attempting to retest the neckline while at the moment being below it. These 4hr patterns are much more fickle than larger time frames so for now no clear direction is certain.Disclaimer
The information and publications are not meant to be, and do not constitute, financial, investment, trading, or other types of advice or recommendations supplied or endorsed by TradingView. Read more in the Terms of Use.
Disclaimer
The information and publications are not meant to be, and do not constitute, financial, investment, trading, or other types of advice or recommendations supplied or endorsed by TradingView. Read more in the Terms of Use.