BTC/USD Potential Bullish Reversal 🟢📈
🔍 Technical Overview:
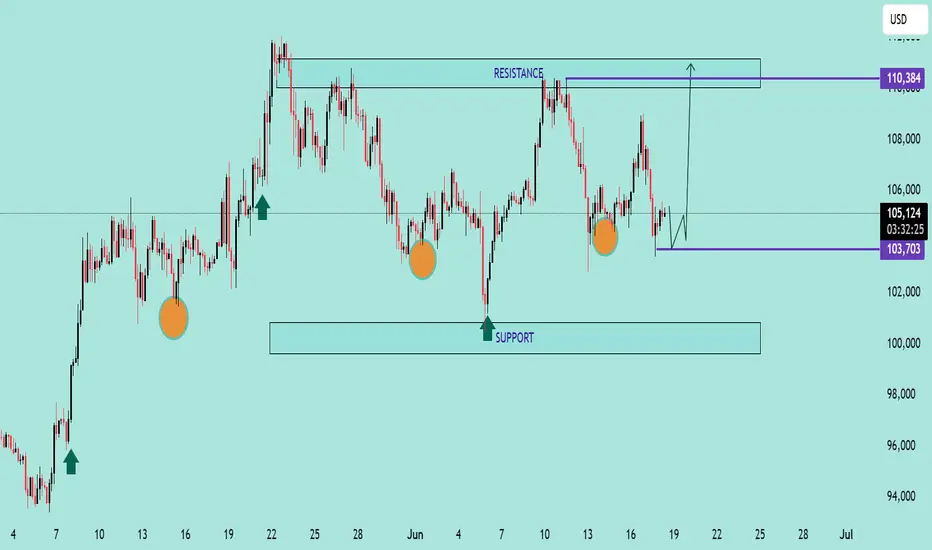
The chart shows a potential bullish reversal pattern forming near a key support zone. Price action has consistently bounced from the support range between $100,000 – $103,700, marked by multiple higher lows (🟠 orange circles), suggesting strong buyer interest.
📌 Key Levels:
Support Zone: $100,000 – $103,700 🛡️
Immediate Resistance: $110,384 🔼
Current Price: $105,202 💰
📊 Pattern Observed:
The price structure shows a possible inverted head and shoulders pattern forming, with the right shoulder currently developing. If this structure completes and breaks the $106,000–$107,000 neckline region, we can expect a bullish breakout toward the resistance target of $110,384 or higher.
📈 Bullish Confirmation:
Bullish rejection from support area ✅
Clean structure with repeated higher lows 📈
Potential breakout arrow suggests move toward the top resistance zone
⚠️ Watch For:
Price must hold above $103,700 to maintain bullish bias
Break below this level may invalidate bullish setup and retest the broader support zone near $100,000
📌 Conclusion:
BTC/USD is setting up for a potential upside breakout if the neckline is broken. Traders should monitor for bullish confirmation before entering long positions.
🔔 Strategy Suggestion:
Buy Zone: $103,700 – $104,500 (on bullish confirmation) 🛒
Target Zone: $110,000 – $111,000 🎯
Stop-Loss: Below $103,000 🛑
🔍 Technical Overview:
The chart shows a potential bullish reversal pattern forming near a key support zone. Price action has consistently bounced from the support range between $100,000 – $103,700, marked by multiple higher lows (🟠 orange circles), suggesting strong buyer interest.
📌 Key Levels:
Support Zone: $100,000 – $103,700 🛡️
Immediate Resistance: $110,384 🔼
Current Price: $105,202 💰
📊 Pattern Observed:
The price structure shows a possible inverted head and shoulders pattern forming, with the right shoulder currently developing. If this structure completes and breaks the $106,000–$107,000 neckline region, we can expect a bullish breakout toward the resistance target of $110,384 or higher.
📈 Bullish Confirmation:
Bullish rejection from support area ✅
Clean structure with repeated higher lows 📈
Potential breakout arrow suggests move toward the top resistance zone
⚠️ Watch For:
Price must hold above $103,700 to maintain bullish bias
Break below this level may invalidate bullish setup and retest the broader support zone near $100,000
📌 Conclusion:
BTC/USD is setting up for a potential upside breakout if the neckline is broken. Traders should monitor for bullish confirmation before entering long positions.
🔔 Strategy Suggestion:
Buy Zone: $103,700 – $104,500 (on bullish confirmation) 🛒
Target Zone: $110,000 – $111,000 🎯
Stop-Loss: Below $103,000 🛑
JOIN MY TELEGRAM CHANNEL
t.me/StellarMarketAnalysis
JOIN MY RECOMMENTED BROKER REFFREL LINK
⤵️one.exnesstrack.net/a/uvd1etcgg1
PARTNER CODE⤵️
uvd1etcgg1
t.me/StellarMarketAnalysis
JOIN MY RECOMMENTED BROKER REFFREL LINK
⤵️one.exnesstrack.net/a/uvd1etcgg1
PARTNER CODE⤵️
uvd1etcgg1
Disclaimer
The information and publications are not meant to be, and do not constitute, financial, investment, trading, or other types of advice or recommendations supplied or endorsed by TradingView. Read more in the Terms of Use.