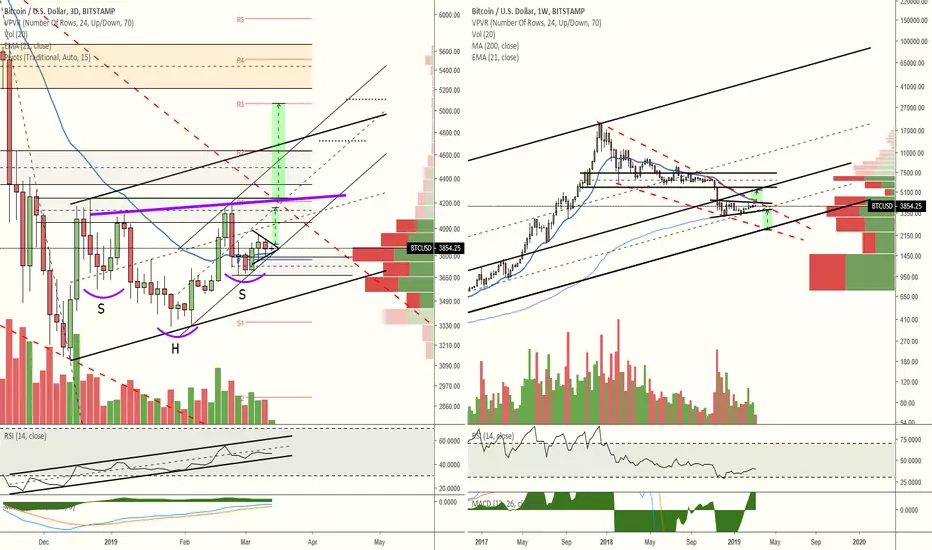
The D3 chart looks a lot more promising than the smaller TFs at this time. A pennant/symmetrical triangle is currently printing and a bullish break should have price targeting the $4150/60 level as well as place price just under the neckline of the possible purple IHS that some people are watching. RSI continues printing an ascending channel but traders should watch for a possible bearish drop through channel support.
The W1 chart shows the multi-year ascending channel I spoke about in the smaller TF update I posted.
The W1 chart shows the multi-year ascending channel I spoke about in the smaller TF update I posted.
Related publications
Disclaimer
The information and publications are not meant to be, and do not constitute, financial, investment, trading, or other types of advice or recommendations supplied or endorsed by TradingView. Read more in the Terms of Use.
Related publications
Disclaimer
The information and publications are not meant to be, and do not constitute, financial, investment, trading, or other types of advice or recommendations supplied or endorsed by TradingView. Read more in the Terms of Use.