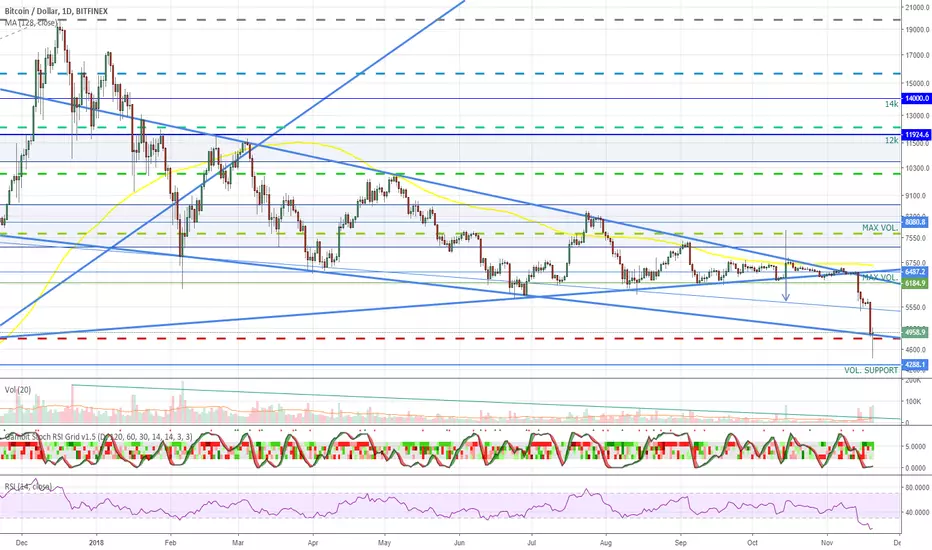
Beside that RSI is on historical lows and chart patterns drawn seem to support it.
Not buying, just keeping an eye on it.
Not buying, just keeping an eye on it.
Note
Seems like falling wedge support couldn't hold the price so we fell bellow. For now we stopped at next support predicted by VPVR indicator (volume peak at this price).
Note
Support around $4,3k broken...seems like we are going for $3k.Note
Seems like we have some support around $3,8k.Note
$3k was also a resistance and support in summer of 2017...I think it will act as support again, at least short term...Note
Bounce on $3,2k, resistance at $4,2kNote
Previous support around 4,2-4.3k hit. BTC still showing some strength.Note
Bounce exactly at resistance. Let's see how much strength BTC has...Note
Daily candle closed green just under resistance...BTC staying strong for now.Note
BTC failed to break price area with a lot of volume in the past so it started bouncing back down. Stopping above 3k-ish would be a positive sign for BTC price.
Note
Related publications
Disclaimer
The information and publications are not meant to be, and do not constitute, financial, investment, trading, or other types of advice or recommendations supplied or endorsed by TradingView. Read more in the Terms of Use.
Related publications
Disclaimer
The information and publications are not meant to be, and do not constitute, financial, investment, trading, or other types of advice or recommendations supplied or endorsed by TradingView. Read more in the Terms of Use.