It's been a long battle between the bulls are the bears in the 3650 to 4200 area.
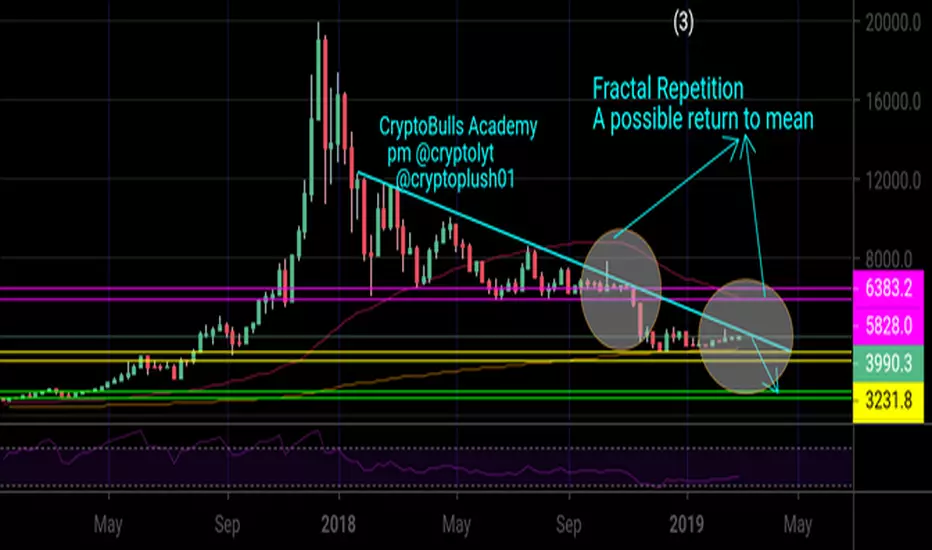
A holistic view of the bitcoin's chart on the weekly time frame shows that price action may be forming this same pattern we saw around the 6000 area, a fractal repition that could lead us to a final capitulation and a possible return to mean.
Aside the recent manipulations within this area, the purpose of which was to liquidate both longs and shorts at diffrent intervals ( we saw this happen many times around the 6000 area before finally breaking down), the bulls appears to be pushing up strong.
The 3950-4000 area appears to be a strong resistance, but I see the bulls pushing price further to the long term downtrend line resistance at the 4200 area again. It's a common thing for a resistance area to finally succumb after too much pressure, and we have seen price challenge this area many times, a final attempt could break through it.
However, a breakout at this point will mean a fake out and a possible bull trap. But this fake out may definitely appear on the chart, as the market must give a higher high to complete the wave 4 of the overall market trend (wave 4 often comes with complex consolidation) before heading down on wave 5 IMO.
With price moving up towards this area again, we may see a bottoming of this bear market come April/May, and in the worst situation June this year. I do not see this bear market extending beyond June with what I am presently seeing on the chart. This is my personal opinion anyways.
Related publications
Disclaimer
The information and publications are not meant to be, and do not constitute, financial, investment, trading, or other types of advice or recommendations supplied or endorsed by TradingView. Read more in the Terms of Use.
Related publications
Disclaimer
The information and publications are not meant to be, and do not constitute, financial, investment, trading, or other types of advice or recommendations supplied or endorsed by TradingView. Read more in the Terms of Use.