
Here's another mechanical lesson for you.
In my last post I covered a mechanical technique to identify swing ranges. Rule-based, simple and repeatable.
In this post, I want to share another little technique, again part of the mechanical series. But this time I want to talk about liquidity.
Most traders talk about liquidity, they might even have a grasp of what it is. But most do not know how liquidity forms the sentiment and how that creates a type of algo for the market.
You might have heard of Elliott wave theory. There is a saying along the lines of "you ask 10 Elliott traders for their count and you get 11 answers".
But the point is here, when you simplify the concept, it's clear to see that sentiment caused by liquidity swings is what causes a repeatable pattern in the market.

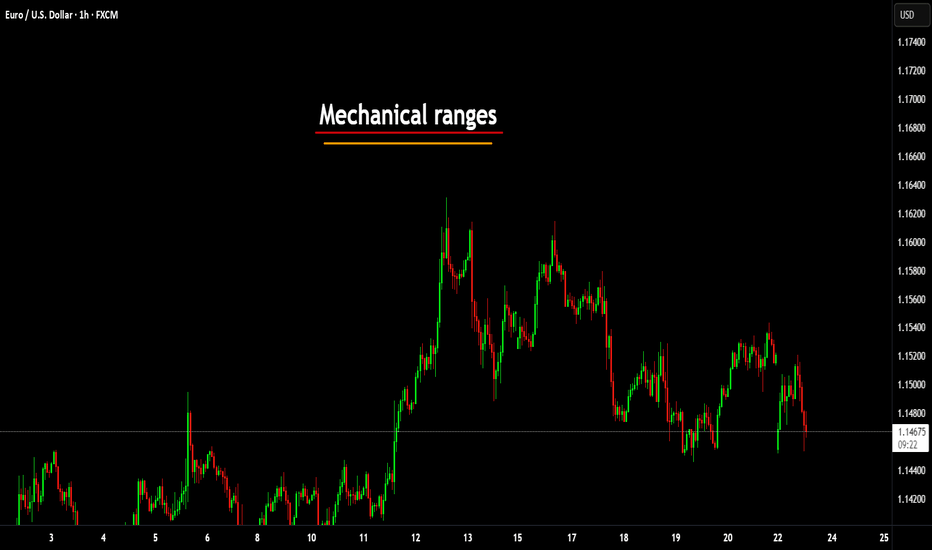
Let's take the idea of the ranges from my last post.

Now after a fair amount of accumulation, this level becomes "defended" - the price will gradually move up until old short stop losses are tagged and new long entries are entered into.
This allows the institutional players to open up their orders without setting off the alarm bells.
Price then comes back from external liquidity to find internal liquidity (more on this in a later post).
But then it looks for the next fresh highs.

As the highs are put in, we can use the range technique to move our range to the new area as seen in the image above.
Next we will be looking for an internal move, not just internal to the range, but a fractal move on the smaller timeframe that drives the pullback down. See this in blue.

The logic here is simple; on the smaller timeframes we have witnessed an accumulation at the 2 region and as we spike up for 3; we will witness a distribution on the smaller timeframes.
Wyckoff called this the accumulation, followed by a mark-up and then the distribution and a mark-down.
It is this pattern, over and over again that leads to this type of structure.

This will then be re-branded by various analysts who will call it things like a head and shoulders, smart money will see a change of character and a retest before breaking the structure.
This is all the same thing - just a different naming convention.
Again, I hope this helps some of you out there!
Disclaimer
This idea does not constitute as financial advice. It is for educational purposes only, our principal trader has over 25 years' experience in stocks, ETF's, and Forex. Hence each trade setup might have different hold times, entry or exit conditions, and will vary from the post/idea shared here. You can use the information from this post to make your own trading plan for the instrument discussed. Trading carries a risk; a high percentage of retail traders lose money. Please keep this in mind when entering any trade. Stay safe.
In my last post I covered a mechanical technique to identify swing ranges. Rule-based, simple and repeatable.
In this post, I want to share another little technique, again part of the mechanical series. But this time I want to talk about liquidity.
Most traders talk about liquidity, they might even have a grasp of what it is. But most do not know how liquidity forms the sentiment and how that creates a type of algo for the market.
You might have heard of Elliott wave theory. There is a saying along the lines of "you ask 10 Elliott traders for their count and you get 11 answers".
But the point is here, when you simplify the concept, it's clear to see that sentiment caused by liquidity swings is what causes a repeatable pattern in the market.
Let's take the idea of the ranges from my last post.
Now after a fair amount of accumulation, this level becomes "defended" - the price will gradually move up until old short stop losses are tagged and new long entries are entered into.
This allows the institutional players to open up their orders without setting off the alarm bells.
Price then comes back from external liquidity to find internal liquidity (more on this in a later post).
But then it looks for the next fresh highs.
As the highs are put in, we can use the range technique to move our range to the new area as seen in the image above.
Next we will be looking for an internal move, not just internal to the range, but a fractal move on the smaller timeframe that drives the pullback down. See this in blue.
The logic here is simple; on the smaller timeframes we have witnessed an accumulation at the 2 region and as we spike up for 3; we will witness a distribution on the smaller timeframes.
Wyckoff called this the accumulation, followed by a mark-up and then the distribution and a mark-down.
It is this pattern, over and over again that leads to this type of structure.
This will then be re-branded by various analysts who will call it things like a head and shoulders, smart money will see a change of character and a retest before breaking the structure.
This is all the same thing - just a different naming convention.
Again, I hope this helps some of you out there!
Disclaimer
This idea does not constitute as financial advice. It is for educational purposes only, our principal trader has over 25 years' experience in stocks, ETF's, and Forex. Hence each trade setup might have different hold times, entry or exit conditions, and will vary from the post/idea shared here. You can use the information from this post to make your own trading plan for the instrument discussed. Trading carries a risk; a high percentage of retail traders lose money. Please keep this in mind when entering any trade. Stay safe.
Discord Server for education and advanced techniques: discord.gg/5t3w47raHe
Masterclass Webinar: mayfairtradingevents.com
Prop firm partners (FTMO)
shorturl.at/hBEQ4
Masterclass Webinar: mayfairtradingevents.com
Prop firm partners (FTMO)
shorturl.at/hBEQ4
Related publications
Disclaimer
The information and publications are not meant to be, and do not constitute, financial, investment, trading, or other types of advice or recommendations supplied or endorsed by TradingView. Read more in the Terms of Use.