I have been using curve analysis for Bitcoin on the weekly time frame for a long time, employing two indicators: My BTC Log Curve and Bitcoin Logarithmic Growth Curves, of course, with my own custom settings to achieve maximum harmony with price movements. I recommend that to gain a precise understanding of Bitcoin curve analysis, you search for and study it, and make use of the two free indicators mentioned above.
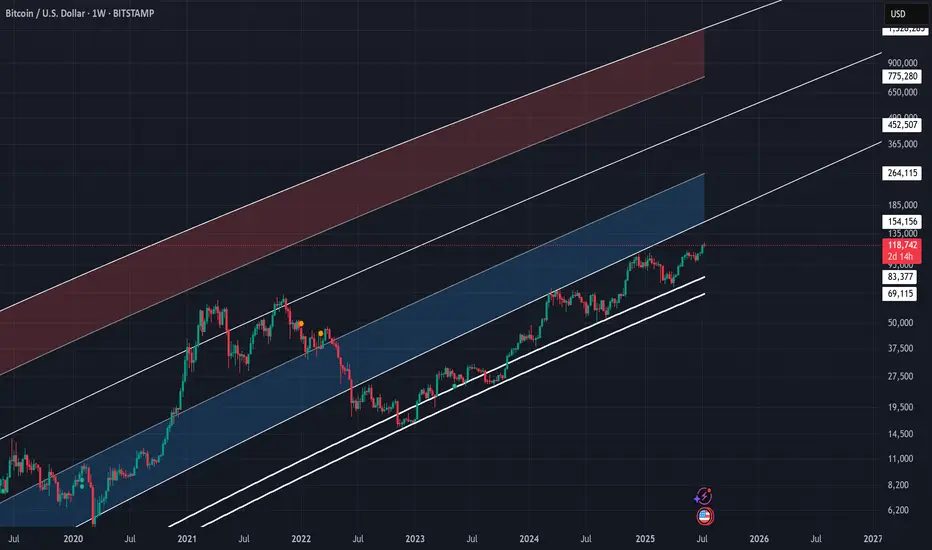
Bitcoin finally managed to break free from the curve floor in the second week of September 2023, initiating a logical and gradual upward trend. Currently, it is supported by a significant level around $84,000 (keeping in mind that this rate will gradually increase due to the market's floating nature). However, the most critical price ceiling for Bitcoin in the current bullish market trend is approximately $154,000. Given the acceptable momentum of the current upward trend, reaching this price target seems reasonable. Nevertheless, we should anticipate a corrective reaction from the market, considering the historical behavior in this price range.
In summary, it can be stated that for mid-term holders, the price target of $154,000 appears to be a realistic and attainable goal, while the price floor of $84,000 serves as a very suitable level for buying and re-accumulating.
Disclaimer
The information and publications are not meant to be, and do not constitute, financial, investment, trading, or other types of advice or recommendations supplied or endorsed by TradingView. Read more in the Terms of Use.
Disclaimer
The information and publications are not meant to be, and do not constitute, financial, investment, trading, or other types of advice or recommendations supplied or endorsed by TradingView. Read more in the Terms of Use.