Bitcoin is showing bullish intent after breaking above a descending trendline resistance on the 1-hour chart. The breakout occurred with decent bullish momentum, suggesting buyers are regaining control in the short term.
📈 Chart Observations:
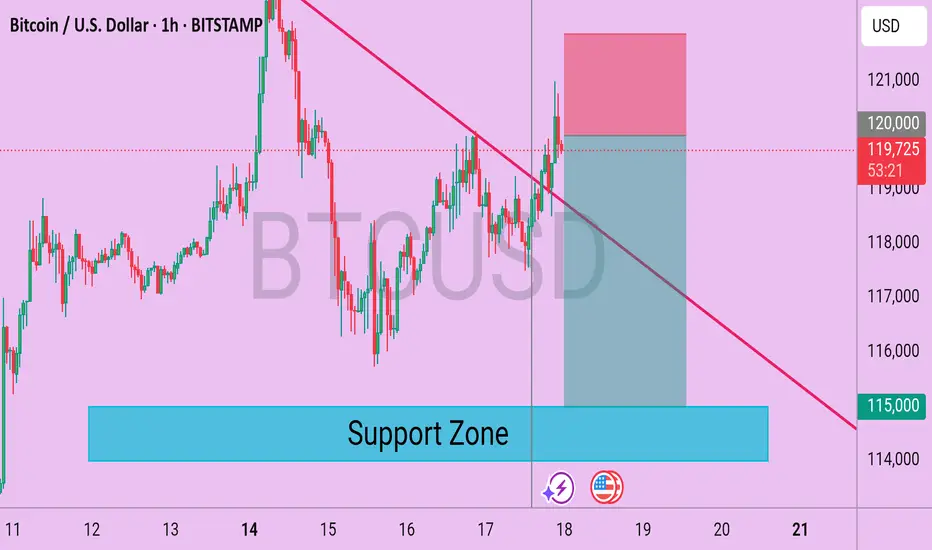
Descending Trendline Broken: Price has successfully broken above a well-respected descending trendline, which acted as resistance over the past few sessions. This breakout may signal a shift in short-term market structure.
Support Zone: The marked support zone around $115,000 continues to act as a critical demand area. Price has rebounded multiple times from this zone, reinforcing its significance.
Current Price Action: BTC is currently trading near $119,800, just under the round-level resistance of $120,000. A clean hourly close above this level could open room for further bullish continuation.
📊 Key Levels:
Resistance: $120,000 (Psychological level)
Immediate Support: $118,000
Major Support Zone: $115,000–$114,000
📉 Bearish Scenario:
If BTC fails to hold above the broken trendline and slips back below $118,000, a revisit of the support zone near $115,000 becomes likely. Bears may step in again if the price fails to sustain higher highs.
✅ Conclusion:
BTC is showing potential for a short-term bullish reversal after breaking out of its descending pattern. Traders should monitor for confirmation through price continuation above $120,000. However, a cautious approach is advised near resistance levels, and invalidation below $118,000 could favor sellers once again.
📈 Chart Observations:
Descending Trendline Broken: Price has successfully broken above a well-respected descending trendline, which acted as resistance over the past few sessions. This breakout may signal a shift in short-term market structure.
Support Zone: The marked support zone around $115,000 continues to act as a critical demand area. Price has rebounded multiple times from this zone, reinforcing its significance.
Current Price Action: BTC is currently trading near $119,800, just under the round-level resistance of $120,000. A clean hourly close above this level could open room for further bullish continuation.
📊 Key Levels:
Resistance: $120,000 (Psychological level)
Immediate Support: $118,000
Major Support Zone: $115,000–$114,000
📉 Bearish Scenario:
If BTC fails to hold above the broken trendline and slips back below $118,000, a revisit of the support zone near $115,000 becomes likely. Bears may step in again if the price fails to sustain higher highs.
✅ Conclusion:
BTC is showing potential for a short-term bullish reversal after breaking out of its descending pattern. Traders should monitor for confirmation through price continuation above $120,000. However, a cautious approach is advised near resistance levels, and invalidation below $118,000 could favor sellers once again.
Disclaimer
The information and publications are not meant to be, and do not constitute, financial, investment, trading, or other types of advice or recommendations supplied or endorsed by TradingView. Read more in the Terms of Use.
Disclaimer
The information and publications are not meant to be, and do not constitute, financial, investment, trading, or other types of advice or recommendations supplied or endorsed by TradingView. Read more in the Terms of Use.