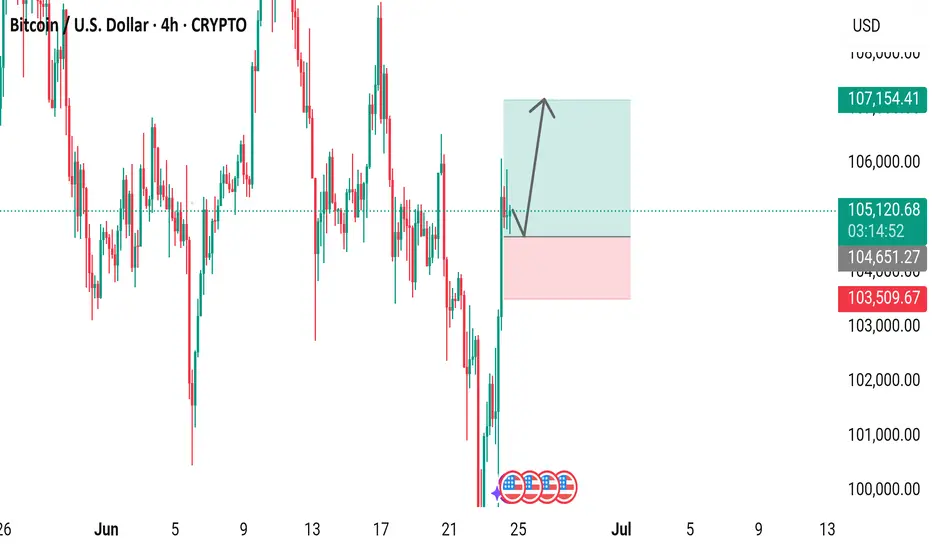
4-hour chart displays the Bitcoin (BTC) to U.S. Dollar (USD) price movement, currently at $105,121.98, reflecting a decrease of $258.74 (-0.25%) as of 03:15:58. The chart highlights a recent downward trend with a potential support level around $103,509.67 and a resistance zone between $104,651.27 and $107,154.41, indicated by shaded areas. The time frame spans from June 6 to June 25, 2025.
Daily XAU/USD FREE setups | Let's grow together!
| XAU/USD Trader | Telegram: https://t.me/Aleegoldsignals
| XAU/USD Trader | Telegram: https://t.me/Aleegoldsignals
Disclaimer
The information and publications are not meant to be, and do not constitute, financial, investment, trading, or other types of advice or recommendations supplied or endorsed by TradingView. Read more in the Terms of Use.