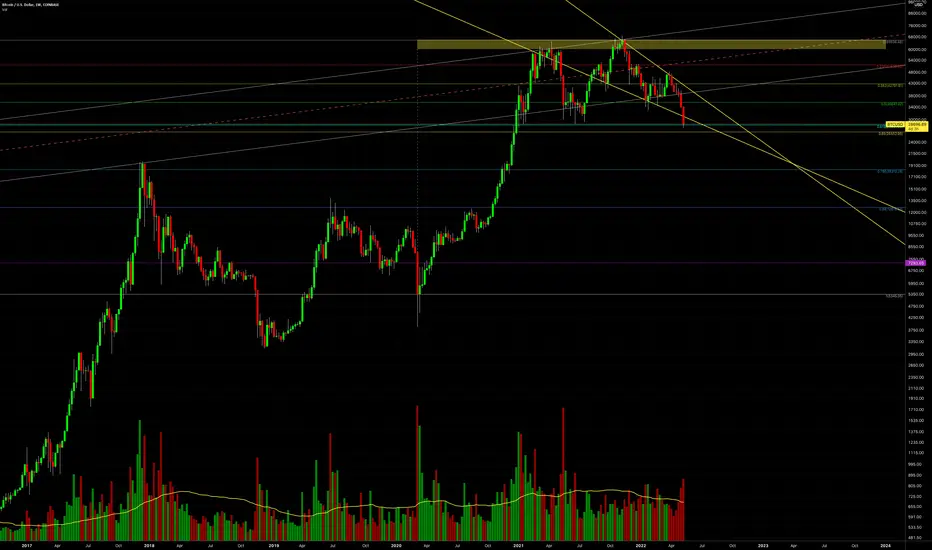
Bitcoin (BTC/USD) - Weekly chart.
Support, Resistance, Trendlines for reference.
Yellow resistance bar was Bearish double-top price pattern from 2021.
note: chart is on Logarithmic scale.
05/11/2022.
Support, Resistance, Trendlines for reference.
Yellow resistance bar was Bearish double-top price pattern from 2021.
note: chart is on Logarithmic scale.
05/11/2022.
Note
Bearish double-top price pattern in play.Follow Me on TradingView, Youtube, X, Instagram.
Social Media links are in my profile.
Boost, comment, share to support.
All posts are not financial advice.
Social Media links are in my profile.
Boost, comment, share to support.
All posts are not financial advice.
Disclaimer
The information and publications are not meant to be, and do not constitute, financial, investment, trading, or other types of advice or recommendations supplied or endorsed by TradingView. Read more in the Terms of Use.
Follow Me on TradingView, Youtube, X, Instagram.
Social Media links are in my profile.
Boost, comment, share to support.
All posts are not financial advice.
Social Media links are in my profile.
Boost, comment, share to support.
All posts are not financial advice.
Disclaimer
The information and publications are not meant to be, and do not constitute, financial, investment, trading, or other types of advice or recommendations supplied or endorsed by TradingView. Read more in the Terms of Use.