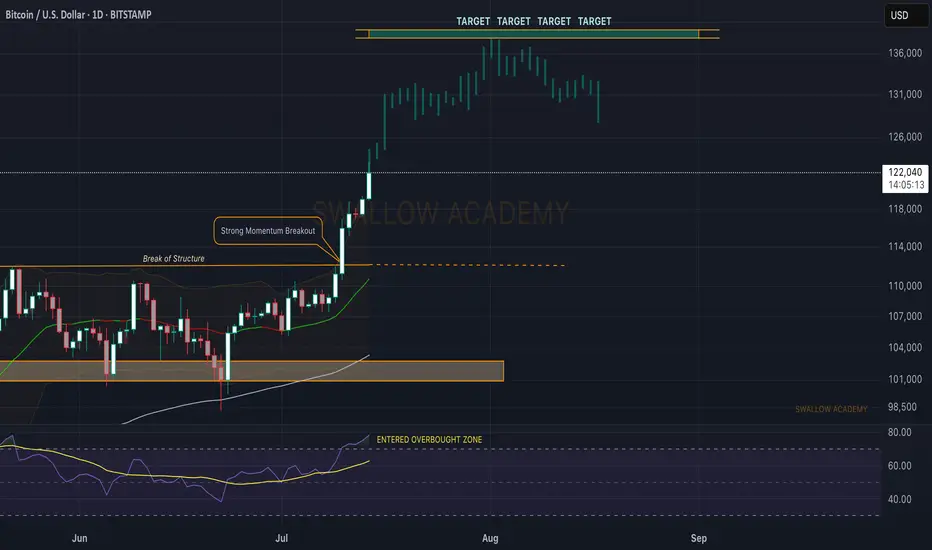
$120K was broken too easily, and we are now setting our new ATH to $140K, which will be our last target and local top before entering into a bearish market.
Now, as we recently had a strong break of structure that was not retested properly (meaning buyers have not secured this area), combined with the RSI being in the overbought zone, we might see some pullback happening anytime from here so keep an eye out for it.
About RSI, our yellow line is still in the neutral area, and we see the demand and buyside volume growing, so we are going to look for that line to also enter into overbought zones before looking for potential selloffs.
Swallow Academy
Note
After a recent push to a new ATH area, the price has cooled down, which led the price back to the local neckline zone, which is our next important zone.
This correction cooled down the Bollinger Bands Channel and RSI, which would mean we are just one MSB (on smaller timeframes) away from another rally towards the upper zones.
Now if for any reason we fall more, then this might turn into a nasty movement, as our target would be then around $110K, where we would be looking for another buy entry (if we fail to get that MSB we are currently looking for).
Note
Buyers are back in control; after a decent correction we had since forming a new ATH, the price has fallen 8K, which is more than enough.
We see the buyside dominance near the neckline area and now we are seeing more and more bullish volume coming in, which indicates just one thing—we are heading for a retest of the local ATH (and we even might break it).
Note
Bitcoin still looks strong;we had a smaller correction recently, but buy-side volume still shows signs of dominance.
Accumulation is on, so we might have a very volatile movement very soon; be careful!
Note
Bitcoin still looks strong;we had a smaller correction recently, but buy-side volume still shows signs of dominance.
Accumulation is on, so we might have a very volatile movement very soon; be careful!
Note
Bitcoin still looks bullish, with no major signs of potential sell-side movement to happen. The least we look for here is the retest of the current ATH, which is the $123K zone, and we will keep this game plan as long as the price stays above $116K.
If we see any signs of a breakdown happening, we might be heading for a bigger correction towards $108K (only if we see a break of $116K).
🚨 Authentic Traders
⚡️ Short-Term + Mid-Term Trades
Keep an eye on us and you will not regret it. 😉
Telegram: t.me/+fiEDSn7M9pJkODA0
⚡️ Short-Term + Mid-Term Trades
Keep an eye on us and you will not regret it. 😉
Telegram: t.me/+fiEDSn7M9pJkODA0
Disclaimer
The information and publications are not meant to be, and do not constitute, financial, investment, trading, or other types of advice or recommendations supplied or endorsed by TradingView. Read more in the Terms of Use.