Today, I want to take a look at the Bitcoin chart using Trading Alpha. This is an indicator suite that I often reference, and the creator Wick is often on my shows.
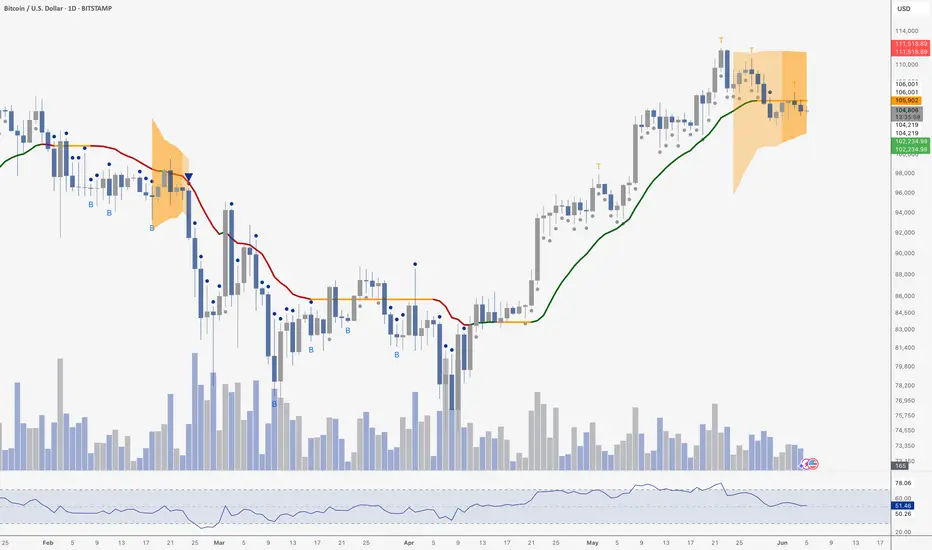
The daily chart paints a shaky picture for Bitcoin (weekly still looks great). As you can see, we have multiple top signals (Ts), which have been confirmed by down candles the next day. We also lost the grey bullish dots last week, and trackline has flipped from support to resistance. The orange squeeze shading indicates that volatility is likely to pick up soon - it could go either way, but the indicators are leaning more bearish for now.
It will be interesting to see what Bitcon does next.
scott.melker@texaswestcapital.com
Disclaimer
The information and publications are not meant to be, and do not constitute, financial, investment, trading, or other types of advice or recommendations supplied or endorsed by TradingView. Read more in the Terms of Use.
scott.melker@texaswestcapital.com
Disclaimer
The information and publications are not meant to be, and do not constitute, financial, investment, trading, or other types of advice or recommendations supplied or endorsed by TradingView. Read more in the Terms of Use.