### *Analysis of the BTC/USD (30-Minute) Chart*
This chart presents a structured approach to analyzing Bitcoin’s price action using *smart money concepts and market structure tools*.
---
### *Key Tools & Patterns Used:*
#### *1. Market Structure Concepts:*
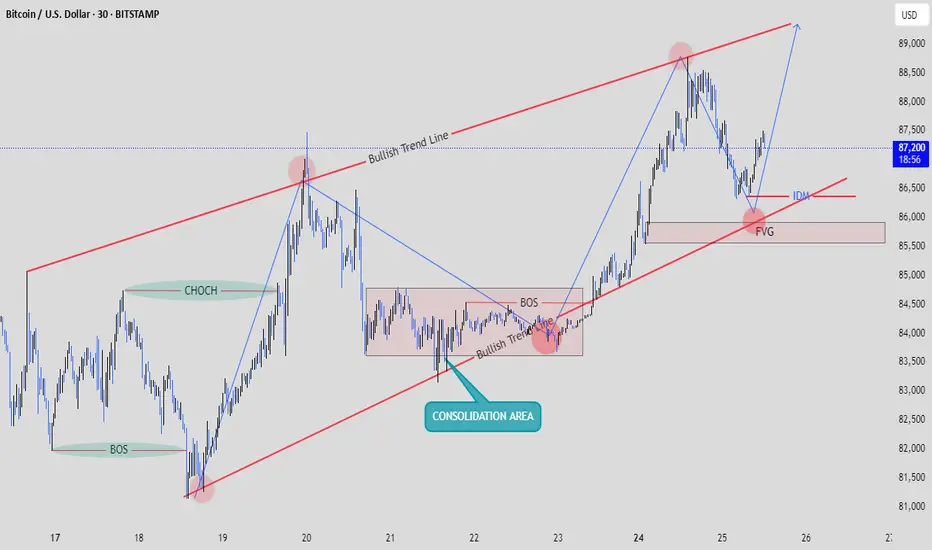
- *CHOCH (Change of Character):*
- A transition from a bearish to a bullish market phase.
- *BOS (Break of Structure):*
- Confirms a bullish breakout after price leaves the consolidation phase.
#### *2. Trend-lines & Chart Patterns:*
- *Bullish Trend Line (Red):*
- Highlights an ongoing uptrend, acting as dynamic support.
- *Parallel Channel Formation:*
- Price follows an *ascending channel*, suggesting bullish momentum.
- *Consolidation Area (Blue Box):*
- A range where price accumulated before the bullish breakout.
#### *3. Liquidity & Key Areas:*
- *FVG (Fair Value Gap - Pink Zone):*
- A market inefficiency that price might revisit before continuing upward.
- *POI (Point of Interest):*
- A key area where price might react, aligning with the trendline and FVG.
#### *4. Trade Setup & Projection:*
- *Bullish Scenario:*
- A pullback to the *FVG & trendline area* could provide a strong buying opportunity.
- *Bearish Risk:*
- A break below the *FVG and trendline* might trigger a deeper correction.
---
### *Conclusion & Trading Implications:*
- *High Probability Long Trade:*
- A retracement to the *FVG/POI* could offer a good buy entry, with targets at the upper trendline.
- *Risk Management:*
- A *break below FVG* would invalidate the bullish setup and suggest further downside movement.
Would you like entry, stop-loss, and take-profit levels based on this analysis?
This chart presents a structured approach to analyzing Bitcoin’s price action using *smart money concepts and market structure tools*.
---
### *Key Tools & Patterns Used:*
#### *1. Market Structure Concepts:*
- *CHOCH (Change of Character):*
- A transition from a bearish to a bullish market phase.
- *BOS (Break of Structure):*
- Confirms a bullish breakout after price leaves the consolidation phase.
#### *2. Trend-lines & Chart Patterns:*
- *Bullish Trend Line (Red):*
- Highlights an ongoing uptrend, acting as dynamic support.
- *Parallel Channel Formation:*
- Price follows an *ascending channel*, suggesting bullish momentum.
- *Consolidation Area (Blue Box):*
- A range where price accumulated before the bullish breakout.
#### *3. Liquidity & Key Areas:*
- *FVG (Fair Value Gap - Pink Zone):*
- A market inefficiency that price might revisit before continuing upward.
- *POI (Point of Interest):*
- A key area where price might react, aligning with the trendline and FVG.
#### *4. Trade Setup & Projection:*
- *Bullish Scenario:*
- A pullback to the *FVG & trendline area* could provide a strong buying opportunity.
- *Bearish Risk:*
- A break below the *FVG and trendline* might trigger a deeper correction.
---
### *Conclusion & Trading Implications:*
- *High Probability Long Trade:*
- A retracement to the *FVG/POI* could offer a good buy entry, with targets at the upper trendline.
- *Risk Management:*
- A *break below FVG* would invalidate the bullish setup and suggest further downside movement.
Would you like entry, stop-loss, and take-profit levels based on this analysis?
Disclaimer
The information and publications are not meant to be, and do not constitute, financial, investment, trading, or other types of advice or recommendations supplied or endorsed by TradingView. Read more in the Terms of Use.
Disclaimer
The information and publications are not meant to be, and do not constitute, financial, investment, trading, or other types of advice or recommendations supplied or endorsed by TradingView. Read more in the Terms of Use.