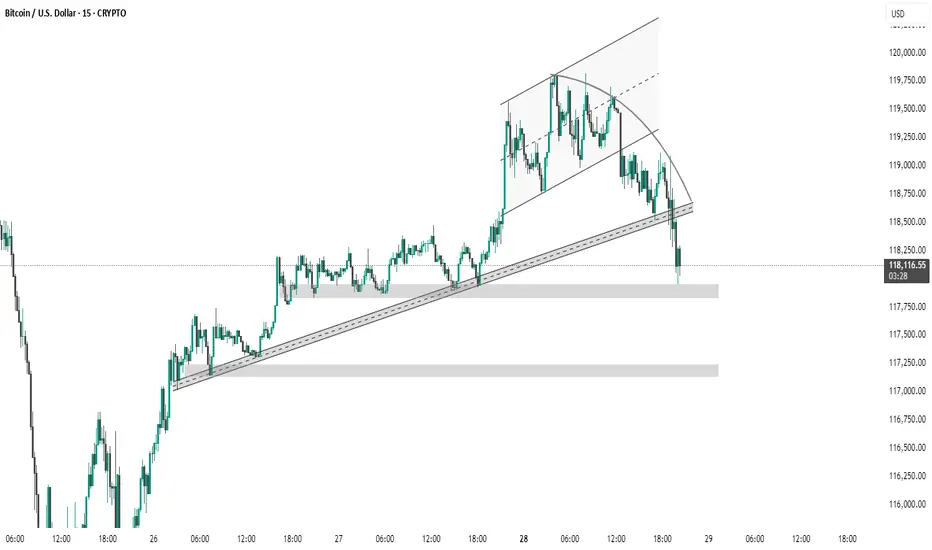
This 15-minute BTC/USD chart shows a clear breakdown from a rising channel, followed by a retest and rejection at the former support trendline. The price has now broken below key trendline support and is testing a demand zone near 118,000 USD. If this level fails to hold, the next support lies around the 117,250–117,000 USD zone. This indicates a potential shift in market structure from bullish to bearish in the short term.
Related publications
Disclaimer
The information and publications are not meant to be, and do not constitute, financial, investment, trading, or other types of advice or recommendations supplied or endorsed by TradingView. Read more in the Terms of Use.
Related publications
Disclaimer
The information and publications are not meant to be, and do not constitute, financial, investment, trading, or other types of advice or recommendations supplied or endorsed by TradingView. Read more in the Terms of Use.