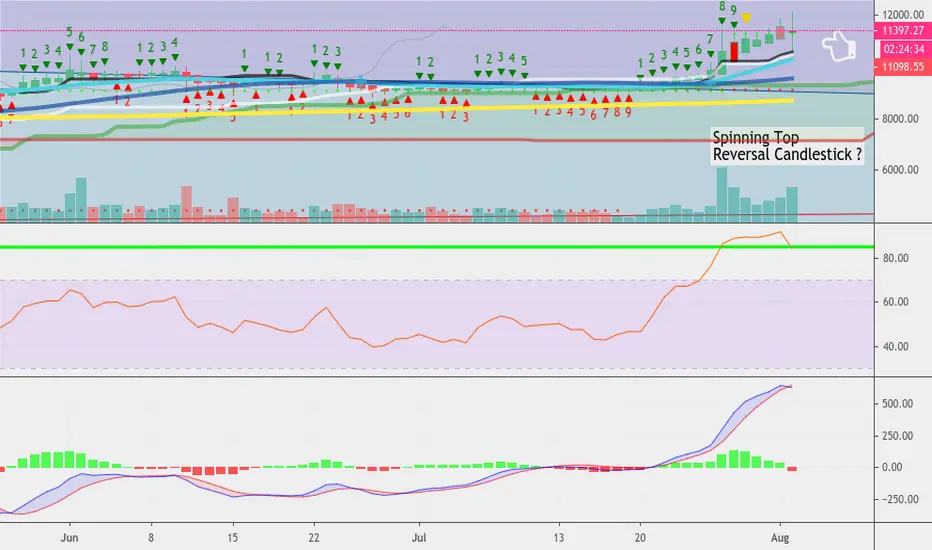
Well , seems we have a classic spinning top candlestick on the Bitcoin 1 day chart . I recently did a chart showing the Gann Fan as well as the CME futures gap on Bitcoin near 118xx which already filled . But now we have what looks like a reversal candlestick . When a candlestick has a very small body evenly in the middle of two long wicks it's called a spinning top - and if it comes after an uptrend then it usually signals a reversal of that trend ( and that we would see some downside .) Same if it came at the end of a downtrend it would signal a reverse to the upside coming.
So we look to our supports below us - 112xx ? 10500 ? Also don't forget we have a CME futures gap below us around 96xx/97xx
Maybe we are going there before we see and more retrace up to this local top near 12k .
So we look to our supports below us - 112xx ? 10500 ? Also don't forget we have a CME futures gap below us around 96xx/97xx
Maybe we are going there before we see and more retrace up to this local top near 12k .
😃 Join shimmeringpath's friendly free
Telegram chat here : bulls and bears both welcome !
t.me/CryptoRisingTradersChat
Telegram chat here : bulls and bears both welcome !
t.me/CryptoRisingTradersChat
Related publications
Disclaimer
The information and publications are not meant to be, and do not constitute, financial, investment, trading, or other types of advice or recommendations supplied or endorsed by TradingView. Read more in the Terms of Use.