📌 Overview of the Chart Setup
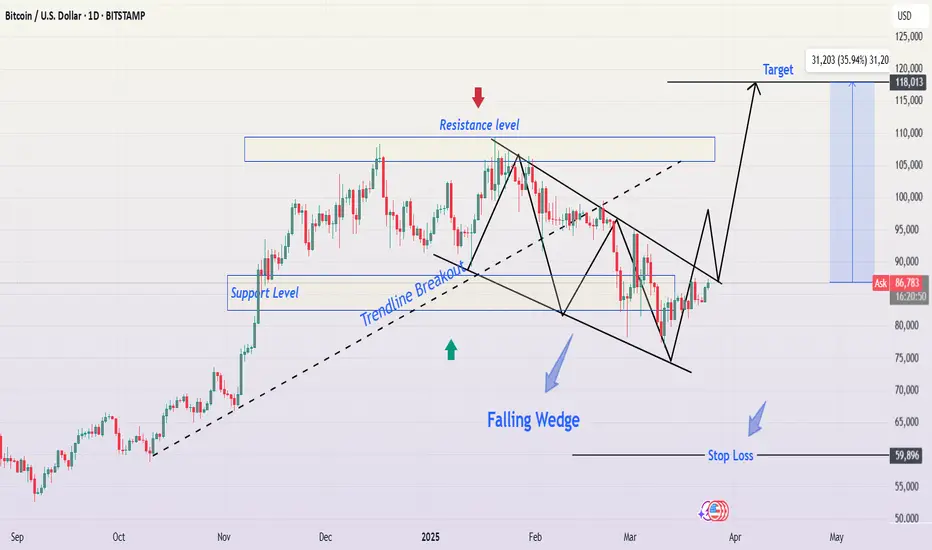
This daily Bitcoin (BTC/USD) chart presents a technical breakout from a falling wedge pattern, a well-known bullish reversal signal. The price has been forming lower highs and lower lows over the past months, consolidating within a tightening structure. However, the current price action suggests an early breakout attempt, which could lead to significant upside movement in the coming weeks.
Let’s break down the key levels, technical insights, and trading opportunities visible in this chart.
📉 Chart Pattern: Falling Wedge (Bullish Reversal)
🔹 What is a Falling Wedge?
A falling wedge is a bullish continuation or reversal pattern characterized by converging downward-sloping trendlines. It typically signals a loss of bearish momentum, leading to a breakout to the upside.
🔹 Key Observations in the Chart
The price has been moving inside the falling wedge structure, with clear lower highs and lower lows.
The support level around $75,000-$80,000 has been repeatedly tested, forming a strong demand zone.
A trendline breakout has occurred, suggesting that bulls are regaining control over the price action.
Volume is expected to increase upon a confirmed breakout, reinforcing the bullish momentum.
📊 Important Technical Levels
1️⃣ Support & Resistance Zones
📌 Support Level: The $75,000-$80,000 zone has acted as a strong base, preventing further downside. Buyers have stepped in multiple times here.
📌 Resistance Level: The $95,000-$100,000 range represents a historical resistance where price has struggled to break through.
2️⃣ Trendline Breakout
The chart clearly shows a breakout above the falling wedge’s upper boundary, indicating a potential trend reversal from bearish to bullish.
If this breakout holds, Bitcoin could see strong buying pressure pushing it toward its next major resistance level.
📈 Trading Strategy & Setup
🔹 Entry Confirmation
To enter a long position, traders should wait for:
✅ A daily close above the wedge resistance (confirmed breakout).
✅ A successful retest of the breakout zone, which strengthens the bullish case.
A breakout retest is ideal because it provides a lower-risk entry point, ensuring the breakout is legitimate rather than a false move.
🔹 Target Price Projection
Using the height of the falling wedge as a projection, the potential price target is set at $118,000.
This level aligns with a 35%+ upside from the breakout zone.
Bitcoin must clear the $95,000-$100,000 resistance before reaching the final target.
🔹 Stop Loss Placement
A stop loss is positioned at $59,896, slightly below the previous major support zone.
This ensures that if the breakout fails, losses are minimized while still allowing price fluctuations within expected volatility.
🔹 Risk-to-Reward Ratio
Entry around breakout level (~$87,000)
Target: $118,000 (35% upside)
Stop Loss: $59,896 (~30% downside)
Risk-to-reward ratio: ~1:3, making this an attractive trade setup.
📢 Market Psychology & Sentiment
Why This Pattern Matters?
A falling wedge represents seller exhaustion. Over time, the bearish pressure weakens, leading to a bullish breakout.
If Bitcoin can maintain this breakout, momentum traders and institutional investors may step in, accelerating the rally.
Breaking above the resistance at $95K-$100K would confirm bullish dominance, potentially leading to new all-time highs.
Potential Risks
❌ Fake Breakout: If Bitcoin fails to hold above the wedge resistance, we may see a pullback to support before another breakout attempt.
❌ Macro Factors: External factors like regulatory news, interest rate decisions, and market-wide sentiment could impact price action.
❌ Bitcoin Dominance: If altcoins start rallying, some capital may rotate out of Bitcoin, slowing the upside move.
🚀 Final Thoughts: A High-Probability Bullish Setup
✅ The falling wedge breakout suggests a strong bullish shift, with a 35%+ potential upside.
✅ A confirmed breakout above $95K-$100K will act as a final confirmation before the next leg up.
✅ Risk is managed with a stop loss at $59,896, ensuring downside protection.
🔹 Best trading approach? Wait for confirmation, manage risk, and let the trend develop.
Would you like additional insights on entry techniques, volume confirmation, or potential invalidation points? 😊
For Daily Trade Setups and Forecast: 📈 t.me/xauusdoptimizer
Premium Signals Fr33: 💯 t.me/xauusdoptimizer
🥰🥳🤩
Premium Signals Fr33: 💯 t.me/xauusdoptimizer
🥰🥳🤩
Related publications
Disclaimer
The information and publications are not meant to be, and do not constitute, financial, investment, trading, or other types of advice or recommendations supplied or endorsed by TradingView. Read more in the Terms of Use.