This is my alternate view to the less Bullish Plot here (click).
The above plot assumes 5 waves up are done, and ABC in progress.
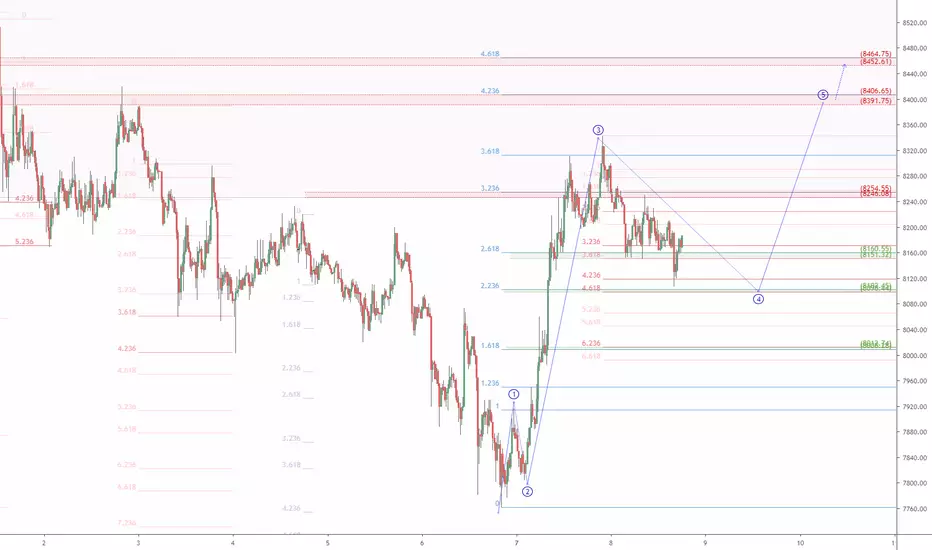
This plot has possibility we are in a wave 4 with wave 5 up to come.
Reaction at the first resistance around $8254 will be key to watch.
Part of my ongoing Bitcoin analysis, been hitting every important turn (click):
8.5k top Call
10.2k Resistance (tight zones plotted)
21k possible target (still possible)
9k bounce call (perfect bounce)
13k warning (early but valid)
12.4k Break
10.9k retrace
12k Impulse
12k target call <=Perfect TP
14k > 10k retrace
14k target call <=Perfect TP
10k target call <=6 wks ago
8.4k > 5.4k retrace
9.0k > 7.5k retrace
7.5k bounce call <=Perfect Entry
10k path laid out
3.1k bottom call (the EXACT bottom)
Of course, I have had total FAILS on some ideas too, not going to pretend.
But all of my plots show PRECISE entries, TIGHT stops, and EXACT targets.
Precision is the way of the Fib. Almost every turn happens at a Fib Line.
.
The above plot assumes 5 waves up are done, and ABC in progress.
This plot has possibility we are in a wave 4 with wave 5 up to come.
Reaction at the first resistance around $8254 will be key to watch.
Part of my ongoing Bitcoin analysis, been hitting every important turn (click):
8.5k top Call
10.2k Resistance (tight zones plotted)
21k possible target (still possible)
9k bounce call (perfect bounce)
13k warning (early but valid)
12.4k Break
10.9k retrace
12k Impulse
12k target call <=Perfect TP
14k > 10k retrace
14k target call <=Perfect TP
10k target call <=6 wks ago
8.4k > 5.4k retrace
9.0k > 7.5k retrace
7.5k bounce call <=Perfect Entry
10k path laid out
3.1k bottom call (the EXACT bottom)
Of course, I have had total FAILS on some ideas too, not going to pretend.
But all of my plots show PRECISE entries, TIGHT stops, and EXACT targets.
Precision is the way of the Fib. Almost every turn happens at a Fib Line.
.
Note
Looks like $ 8160 will be CRITICAL for the bull case .
the Golden Ratio is my Religion
the Trading View is my Nation
the Moderator Tag is my Flag
the Trading View is my Nation
the Moderator Tag is my Flag
Related publications
Disclaimer
The information and publications are not meant to be, and do not constitute, financial, investment, trading, or other types of advice or recommendations supplied or endorsed by TradingView. Read more in the Terms of Use.