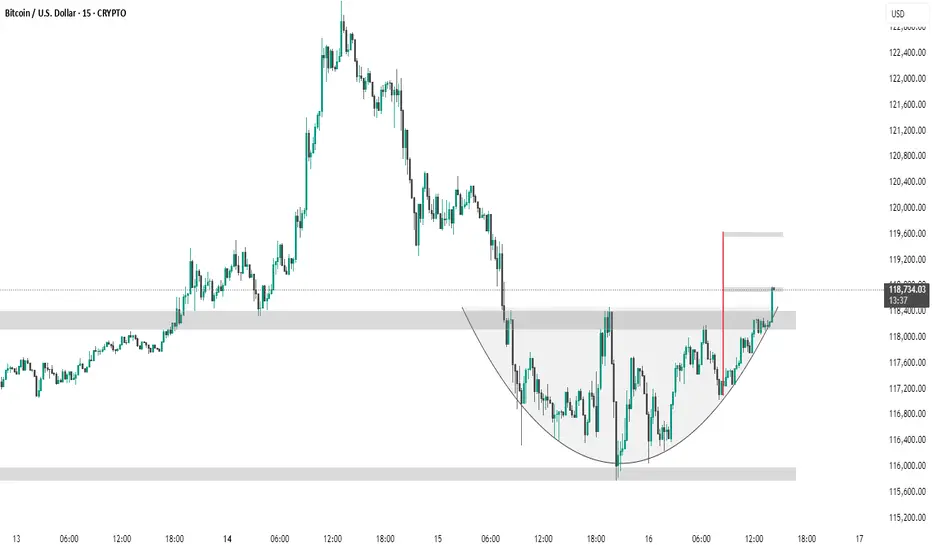
The chart shows a 15-minute BTC/USD timeframe forming a cup and handle pattern, a bullish continuation signal. Price has broken above the handle resistance zone (~$118,400), suggesting a potential breakout. The red vertical line marks the expected target, projecting a move toward the $119,600 level based on the pattern height.
Related publications
Disclaimer
The information and publications are not meant to be, and do not constitute, financial, investment, trading, or other types of advice or recommendations supplied or endorsed by TradingView. Read more in the Terms of Use.
Related publications
Disclaimer
The information and publications are not meant to be, and do not constitute, financial, investment, trading, or other types of advice or recommendations supplied or endorsed by TradingView. Read more in the Terms of Use.