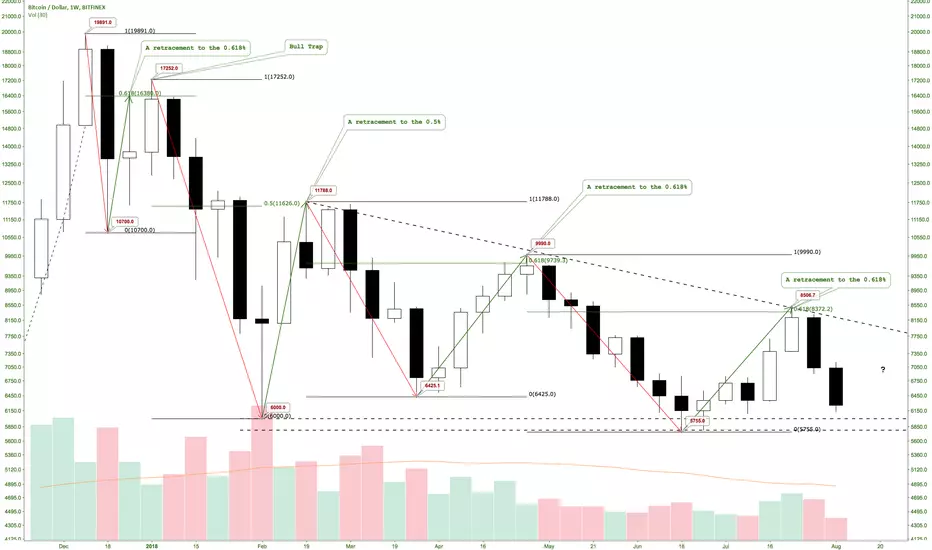
The chart shows the four leg-down with their retracements.
In the first retracement is labelled the bull trap it occurred when the price exceeded the 0.618%
The current leg-down is still developing
In the first retracement is labelled the bull trap it occurred when the price exceeded the 0.618%
The current leg-down is still developing
Note
Using the tool Trend-Based Fib Extension to project the end point of the current leg down two possible points appears (labelled with a green flag)0.618% 5889,5
0.786% 5178
Note
Descending Triangle And key levels in the short term S/R (green line/red line)Note
The price is testing the triangle's base for third time Note
$600k is holding, for now, but every test makes weaker the supportNote
The support ($6000) still holding Note
Commented on August 9th.Using the tool Trend-Based Fib Extension to project the end point of the current leg down two possible points appears (labelled with a green flag)
0.618% 5889,5
0.786% 5178
Note
The most relevant patterns Note
Fibonacci retracementDisclaimer
The information and publications are not meant to be, and do not constitute, financial, investment, trading, or other types of advice or recommendations supplied or endorsed by TradingView. Read more in the Terms of Use.
Disclaimer
The information and publications are not meant to be, and do not constitute, financial, investment, trading, or other types of advice or recommendations supplied or endorsed by TradingView. Read more in the Terms of Use.