Previous analysis/position: Ichimoku clouds turning bullish. Green 2 > Green 1 on the weekly. First time we have traded above the parabolic SAR since the bear market started. Incoming death cross on the 50 & 30 week MA’s. Largest volume profile over the past year is $7,576 to $8,287. 0.382 FIB = $8,496 / remaining on the sideline while waiting for further development.
Patterns: Higher low at $7,900 is it in the process of making a lower high below $8,288?
Horizontal support and resistance: weak R: $8,277 strong R: $8,490 | weak S $8,140 strong S: $7,745
BTCUSDSHORTS: Long:Short ratio = 60:40 | Still testing 18,500 for support.
Funding Rates: Longs pay shorts 0.0749%
12 & 26 EMA’s (calculate % difference): 12 = +4.84% | 26 = +11.01%
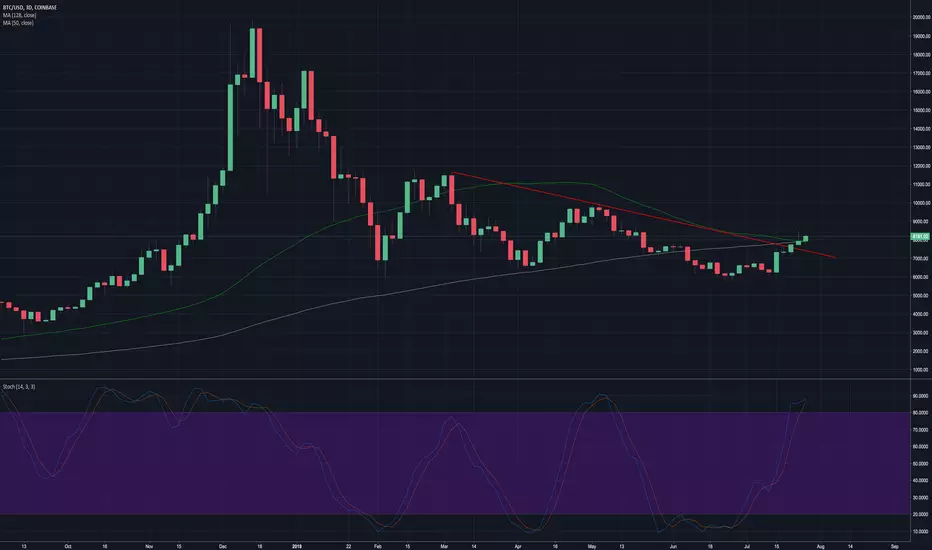
50 & 128 MA’s: 50 = +20.49% | 128 = +7.85% | Just made bearish cross on 3D + trading in the wick on a shooting star could provide low risk entry (stop loss above shooting star wick)
FIB’s: 0.382 = $8,496 | 0.5 = $10,677
Candlestick analysis: Daily hanging man yesterday and bearish spinning top forming today. 3d shooting star
Ichimoku Cloud: Still inside bearish cloud - traditionally considered a no trade zone. Top of the cloud is $8,700. 3d cloud is starting to thicken. Currently testing weekly Tenkan-Sen for resistance. Tenken-sen support on 12h.
TD’ Sequential: G-1 following 4 candle correction on daily. G-2 > G-1 on weekly.
Visible Range: Largest volume profile over last 24h = $8,175 | Last 5 days = $8,208 | Last month = $7,433 | Last year = $7,560 - $8,287
BTC’ Price Spreadsheet: 12h = -0.5% | 24h = +0.98% | 1w = +10.57% | 2w = +28.84% | +39.74%
Bollinger Bands: Testing top of 3d band for resistance. Back above the weekly MA.
Trendline:
Daily Trend: Connect 7/16 to 7/27 | currently in danger of breaking down.
Fractals: UP = $8,490 | DOWN = $7,203
On Balance Volume: Establishing lower high/bear flag/potential h&s
Chaikin Money Flow: Weekly trying to break through 0.05 | Daily looks like it is struggling to establish a higher high.
Buy/Sell Sentiment on Trading View (countertrade): Oscillators = Buy | MA’s = Strong Buy | Summary = Buy
RSI: Daily looks very similar to OBV. Weekly is > 50.
Stoch: Just made bullish re cross on daily in overbought territory | Weekly shows plenty of room to go. Incoming sell signal on 3d.
Summary
Very interested to see if we establish a lower high on the daily chart. Price pulling up and into death cross on 3d chart could be providing a good short sale entry. The shooting star on the 3d is very bearish. The trendline breaking down would provide confirmation for a bearish entry. The visible range volume profile shows the most resistance at current price levels when looking back 1 year. Cannot recall the last time it was this expensive to hold a long on Bitmex. That indicates that too many people having been taking the same side of the trade and I strongly expect a long squeeze to be on the horizon.
Possible Entry
Could open a short at the current price level (one third of the desire position) due to the 3d death cross combined with the shooting star, horizontal resistance, visible range volume profile and the upcoming sell signal on the Stoch.
$7,600 and $6,800 have been identified as strong levels of support.
If a bounce from $7,600 leads to a lower high then it would be time to add another third. If a bounce from $6,800 leads to another lower high then it would be time to max out the position.
Stop loss at $8,560 provides an attractive risk to reward ratio and can be adjusted with each lower high.
I am still watching the triangle on ETH closely and will likely be trading it instead. It does not have the same support below the current price and is also offering a better risk:reward ratio. Click here for my full analysis.
Patterns: Higher low at $7,900 is it in the process of making a lower high below $8,288?
Horizontal support and resistance: weak R: $8,277 strong R: $8,490 | weak S $8,140 strong S: $7,745
BTCUSDSHORTS: Long:Short ratio = 60:40 | Still testing 18,500 for support.
Funding Rates: Longs pay shorts 0.0749%
12 & 26 EMA’s (calculate % difference): 12 = +4.84% | 26 = +11.01%
50 & 128 MA’s: 50 = +20.49% | 128 = +7.85% | Just made bearish cross on 3D + trading in the wick on a shooting star could provide low risk entry (stop loss above shooting star wick)
FIB’s: 0.382 = $8,496 | 0.5 = $10,677
Candlestick analysis: Daily hanging man yesterday and bearish spinning top forming today. 3d shooting star
Ichimoku Cloud: Still inside bearish cloud - traditionally considered a no trade zone. Top of the cloud is $8,700. 3d cloud is starting to thicken. Currently testing weekly Tenkan-Sen for resistance. Tenken-sen support on 12h.
TD’ Sequential: G-1 following 4 candle correction on daily. G-2 > G-1 on weekly.
Visible Range: Largest volume profile over last 24h = $8,175 | Last 5 days = $8,208 | Last month = $7,433 | Last year = $7,560 - $8,287
BTC’ Price Spreadsheet: 12h = -0.5% | 24h = +0.98% | 1w = +10.57% | 2w = +28.84% | +39.74%
Bollinger Bands: Testing top of 3d band for resistance. Back above the weekly MA.
Trendline:
Daily Trend: Connect 7/16 to 7/27 | currently in danger of breaking down.
Fractals: UP = $8,490 | DOWN = $7,203
On Balance Volume: Establishing lower high/bear flag/potential h&s
Chaikin Money Flow: Weekly trying to break through 0.05 | Daily looks like it is struggling to establish a higher high.
Buy/Sell Sentiment on Trading View (countertrade): Oscillators = Buy | MA’s = Strong Buy | Summary = Buy
RSI: Daily looks very similar to OBV. Weekly is > 50.
Stoch: Just made bullish re cross on daily in overbought territory | Weekly shows plenty of room to go. Incoming sell signal on 3d.
Summary
Very interested to see if we establish a lower high on the daily chart. Price pulling up and into death cross on 3d chart could be providing a good short sale entry. The shooting star on the 3d is very bearish. The trendline breaking down would provide confirmation for a bearish entry. The visible range volume profile shows the most resistance at current price levels when looking back 1 year. Cannot recall the last time it was this expensive to hold a long on Bitmex. That indicates that too many people having been taking the same side of the trade and I strongly expect a long squeeze to be on the horizon.
Possible Entry
Could open a short at the current price level (one third of the desire position) due to the 3d death cross combined with the shooting star, horizontal resistance, visible range volume profile and the upcoming sell signal on the Stoch.
$7,600 and $6,800 have been identified as strong levels of support.
If a bounce from $7,600 leads to a lower high then it would be time to add another third. If a bounce from $6,800 leads to another lower high then it would be time to max out the position.
Stop loss at $8,560 provides an attractive risk to reward ratio and can be adjusted with each lower high.
I am still watching the triangle on ETH closely and will likely be trading it instead. It does not have the same support below the current price and is also offering a better risk:reward ratio. Click here for my full analysis.
emasar Indicator is available for purchase at alphanalysis.io/product/emasar/
Disclaimer
The information and publications are not meant to be, and do not constitute, financial, investment, trading, or other types of advice or recommendations supplied or endorsed by TradingView. Read more in the Terms of Use.