This is a continuation from the previous post which factors 2019 top fractal and its spot on so far. Link below.
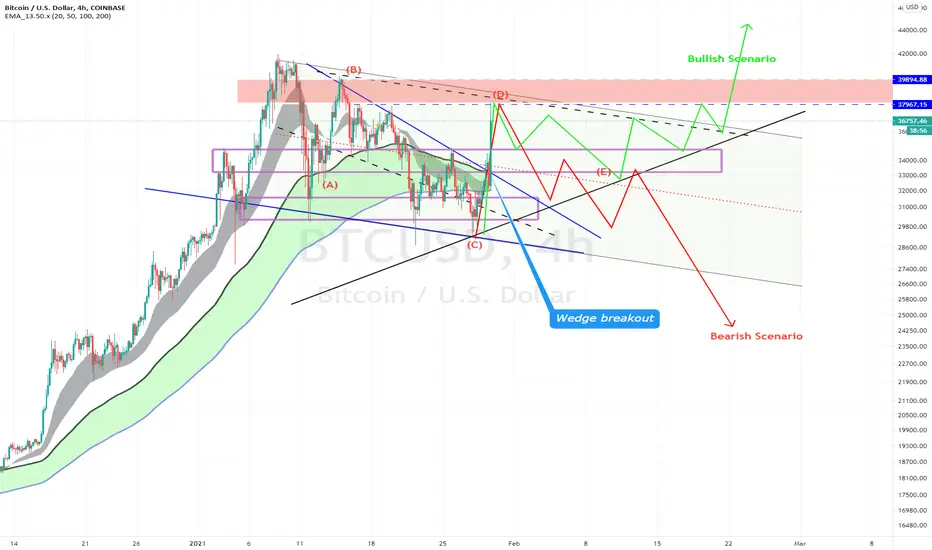
Hi All,
A recent post I did on the 2019 top was and is so far spot on with the bottom bounce and so far this top range.
Where from here?
I have 2 out of 3 scenario's here\ levels where this price can hit. The 3rd scenario is a mixture of these 2.
The 1st target was hit just now and the 2nd target is a bit higher based on the Wedge breakout target and its confluence with previous resistance levels.
If we hit the 2nd target, then that's really encouraging. Anywhere in between is just as good as hitting T2.
Note how the 20/50 and 100/200 ema ribbons can potentially play support

If price pulls back deep, then than can represent a top off structure, like 2019 represented by the red path.
If price pulls back moderately, represented by the lime path, then we are likely to have a large triangle or spanning wedge formation.
Hence for now, we are missing this last piece of the puzzle.
At this point, I'm more bullish and hopeful that this is a large continuation pattern.
PS. My previous post on the fractal points out the similarities between 2019 and now.
All the best,
S.SAri
3rd Scenario

PREVIOUS POST
Hi All,
A recent post I did on the 2019 top was and is so far spot on with the bottom bounce and so far this top range.
Where from here?
I have 2 out of 3 scenario's here\ levels where this price can hit. The 3rd scenario is a mixture of these 2.
The 1st target was hit just now and the 2nd target is a bit higher based on the Wedge breakout target and its confluence with previous resistance levels.
If we hit the 2nd target, then that's really encouraging. Anywhere in between is just as good as hitting T2.
Note how the 20/50 and 100/200 ema ribbons can potentially play support
If price pulls back deep, then than can represent a top off structure, like 2019 represented by the red path.
If price pulls back moderately, represented by the lime path, then we are likely to have a large triangle or spanning wedge formation.
Hence for now, we are missing this last piece of the puzzle.
At this point, I'm more bullish and hopeful that this is a large continuation pattern.
PS. My previous post on the fractal points out the similarities between 2019 and now.
All the best,
S.SAri
3rd Scenario
PREVIOUS POST
Note
Just adding the indicators on the 4 hrly, 8 hrly, 12 hrly.4 HRLY > WT hit the top while the others demonstrate upward pressure., next 4 hours will tell more.
8 HRLY > Phoex passes 50% level, upward pressure but not enough.
Note how the macd on all charts shows bullish div.
12 HRLY has the macd signal cross over...bullish sign. Phoeix still requires the red RSI to go above 50% for a longer time frame for bullishness. Not there yet.
Note
Now like the previous fractal that has guided me to make accurate calls, look at these 3 items\points on the chart ....we are still bullish. I will become bearish if it loses this level. Left 2019 right today.
Note
Note
I sold some of my BTC once it was evident it was dropping more at 33700.We have bullish and bearish scenarios. Currently its still bullish as the weekly 10/20 ema is moving closer to the structure represented by my 2 green lines that I traced over from the weekly.
Having price action test the weekly 10/20 ema is normal and expected from time to time.
Note
Note
Cancel that...not going thereNote
This is a top formation like 2019, I am now convinced. How far will this pullback be , like 2019 is the question.Note how many of the ALTs have hit their tops and struggling to do more.
Now we have the shit-coins doing their runs, the last group.
BTC looks like the fib fan layer, each layer getting visited and eventually giving way.
That wick on the daily was the clue. In a day, it dropped hard.
I will go bullish if it closes above this level of 35k on the 4 hrly. Red lines
Note
Note
A good sign and hence why many ALTs have gone. BTC has closed above the main resistance.I did not buy any BTC, rather flipped to ETH. Until BTC hits 38K and holds, I am not convinced we are in an uptrend. Hence I would rather buy better looking trends with the ALTs as per my posts of lately
Note
Perfectly hit my fib \ resistance level.Lets see if it holds this level with stubbornness or drops. If it drops hard, another clue.
Discord: discord.com/invite/vb4hbP88vb (TradeToProspa)
Telegram: t.me/TprospaTradersbot
This community has signals now but with no risk management comms.
Telegram: t.me/TprospaTradersbot
This community has signals now but with no risk management comms.
Related publications
Disclaimer
The information and publications are not meant to be, and do not constitute, financial, investment, trading, or other types of advice or recommendations supplied or endorsed by TradingView. Read more in the Terms of Use.