Bitcoin Update Still strong whilst within the new Parallels
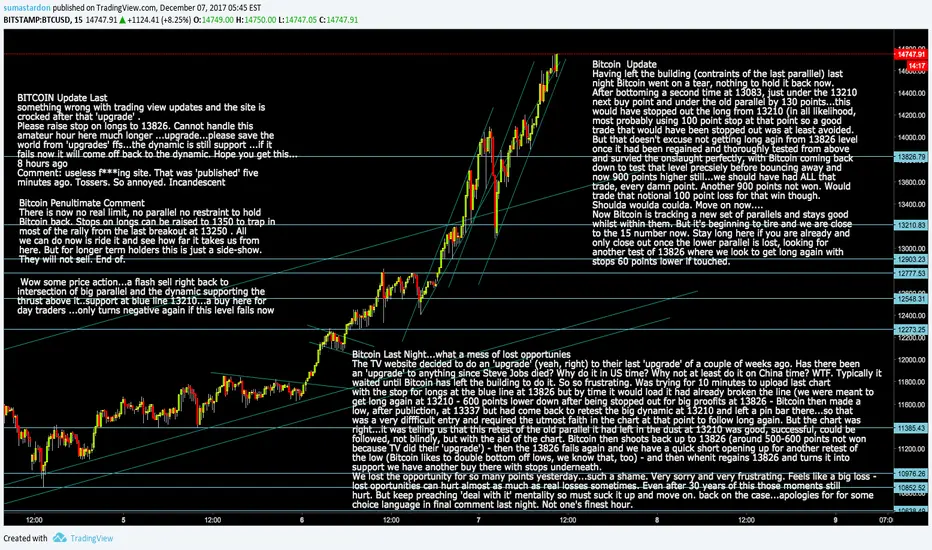
Having left the building (contraints of the last paralllel) last
night Bitcoin went on a tear, nothing to hold it back now.
After bottoming a second time at 13083, just under the 13210
next buy point and under the old parallel by 130 points...this
would have stopped out the long from 13210 (in all likelihood,
most probably using 100 point stop at that point so a good
trade that would have been stopped out was at least avoided.
But that doesn't excuse not getting long agin from 13826 level
once it had been regained and thoroughly tested from above
and survied the onslaught perfectly, with Bitcoin coming back
down to test that level precsiely before bouncing away and
now 900 points higher still...we should have had ALL that
trade, every damn point. Another 900 points not won. Would
trade that notional 100 point loss for that win though.
Shoulda woulda coulda. Move on now....
Now Bitcoin is tracking a new set of parallels and stays good
whilst within them. But it's beginning to tire and we are close
to the 15 number now. Stay long here if you are already and
only close out once the lower parallel is lost, looking for
another test of 13826 where we look to get long again with
stops 60 points lower if touched.
Note
One other interesting thought: The greatest trader who ever lived - W D Gann - said that a stock is 'never too low to sell and never too high to buy'. For 30 years have struggled with the latter part of that statement...surely a stock can get so high that it's madness to chase it? Even Internet v1 from 1997 to early 2000 showed us that. But then along comes Bitcoin. The 'special' one. This creature is a breed apart. It really does finally confirm what WD was saying. He was looking at the radio boom of the early 1900's. That's what he saw. Bitcoin shows us it's not really about price - all we need to do is to trade successfully is: 1. identify parallels (the original 'vibration' that Gann was trying to explain to us when he said that every stock vibrates) and2. identify continuation patterns as opposed to downtrends forming (the parallels will help to determine this) - as Gann said, we should not be scared of price. Respectful but not scared off by it. The chart tells us when to buy and when to sell, and not some notional price showing on the screen. price doesn't really matter - if it did no one would buy Bitcoin, would they? It's patterns that matter - more than price. Ridiculous? See Bitcoin and say that isn't so! Careful now...parallel is being tested again...if it breaks now close out longs, as above
Note
BITCOIN Update 2 potential entry pointsTrying to make a flag pattern here with 2 strikes on the lower line... no interest in a long entry unless 1460 is taken back by bulls and then holds (stops under here by 50 points plus if we see it) It's still vulnerable below here ...ideally to a bigger sell off back to 13826 ideal entry long with stops 50 plus under if we see it. But so far the flag/continuation pattern is working so it could be option 1 coming...let's see
The blue line is working well, so far
Note
So we were FORCED into going long at mad prices because the chart told us to do it. The pattern said HOT yes? Even now. You get Gann now? It's not the price it's the pattern!!! The sooner newbies get that rather simple but true FACT of investing they will free themselves of a lie, a misnomer, a fake-belief, a dogma...they will begin to be 'free'...to think FREELY - it ain't about price, it's about pattern. Bitcoin surely proves it. Please use the little dynamic support on chart as exit for longs if day tradingNote
Note
Bitcoin UpdateParallel Worlds
Drawing Parallels: good example today of an evolving trend as it emerges from bottom of flag at 14107 and breaks to 14594 (entry level for new long on successful retest of the line with stop at least 50 points below the line - subsequent low at 14550 so stops under 14544 came close but were never hit, the trade stayed good) - the uptrend stayed good with only pins appearing on the 5 minute chart around the 15169 level...it was beginning to evolve here and potentially break down...in early stages it is obviously by definition a little vague...mentioned recently about trying to find a line, either top or bottom that 'rang' true, that connects all the tiny correction highs/or lows PERFECTLY, without forcing it...so at that point put a line through the highs of the run (as soon as you have 3 minor highs or lows to connect to)....strangely, miraculously one of the two lines will ring true. Once you have that, duplicate the line and angle and rest it against the highest high of the run or lowest low of the run, depending on which line is true (upper or lower); in this case it was the upper line that was true so we attach a duplicate to the lowest point of the run underneath, which is the massive green candle at 14107. Note also how very often the original speed line we began with does act as a kind of median line and will often mark out the rough area of the high of the run being examined, as here. Just a strange anomaly that happens quite a lot, so it's always worth keeping the original going on the chart, just to see if it does act as reistance/the end point of the move...useful for day traders sometimes, but not not always. Just worth a note in the margin though if newer to this game of chicken - for that is what Bitcoin is now: a game of dare. Do you dare to own Bitcoin at this price? Yes if the chart says it's Ok to do so. And no if it doesn't. That way we can keep something no one understands fairly simple. We follow the chart, not Bitcoin per se. We want to trade Bitcoin not fall in love with it. Some days it's hard not to, though.
If you used the the original speed line to exit you came a out at 15230 for a 630 point gain and if you weren't faked out by the pin bar there the next exit, on the first larger red candle that finally broke the original speed line decisively the exit was around 15581 for 990 win, maybe just a few points shy. But if you get the idea of following on 5 minute or 1 minute chart how the parallels are evolving once you get the clues at the second and then third little high/low of the move...see how the the three touches on the upper parallel are perfect/true/unforced? If you see this you pretty much know it's good.
Part 2 next
Note
Part 2 Parallel WorldsSo, if you moved as it moved, you could have stayed long up to around the 15665 level for a 1700 point win...in 4 hours and out very close to the highs and missed that massive gap...a new first for Bitcoin. It just doesn't do that EVER.
So is this a perfect world scenario or is it actually doable? That's for you to decide. By being adaptable to what the chart is telling you as quickly as possible it will help you to trade more effectively and emotionlessly. The parallels here still weren't perfect on the downside with one pin bar that would cause concern for long positions - at that moment it came back quickly and left a pin to tell you there was quite strong interest there....reaasurance after a nasty, twitchy 2 minutes...those moments are tough to ride ...is it showing a problem getting back above the line once it's lost it...is it sticking under the line or is bought back quickly and leaves a pin off the line, even better? ..this will help to tell you what is most likely to happen next. None of these are foolproof. But they are the best pointers we have at that critical moment of decison...to stay with it or leave. Interesting that the gap happened right through the parallel. Someone must have sold a whole Bitcoin there by the look of it to cause such a gap. (arf). This gap is worrying, despite the lame joke.
It's still weak under 15581-15647. Have been trading the crap out of this for 34 days with one day off in the slammer. Finally want to watch what happens here...it's another flag though isn''t it? But it has a gap above it. Conflicting signals. Stand back for now. Relax. as if. You should be long without even needing to be told now - on exit of the flag. But be careful as we come to fill the gap at 15821..close out there and go long again on break of the high or on retest, using stops as usual.
Now you can try drawing the new potential lines on this new uptrend but be aware that as before this line shown on the chart is likley justa rough speed line and will evolve more clearly after the first and second minor corrections...that's when you start to look for for the line that offers you least resistance..that fits without messing...that FEELS right. Hope this helps
Note
Pilgrim's Progress - How to avoid the slough of Despondency (getting trapped/fooled/misled by a 'top/' writer)Um sorry to say that the fantastic effort some of you put in the other day to try to love bomb the Tradingview algo into the trashcan worked for me but not the mofo algo. I kid you not, but all those likes resulted in zero addition to the rep ...seriously. So that really bafffled me. Fighting a machine that didn't even register..wtf? So it looks like any OLD comment that you 'agreed' with is too out of date for the sad old algo to even register. So having figured that out finally - and having seen what kind of rep you need to dislodge even the lowest (6th) of the so-called 'top' writers (over 700 increase in rep/agrees in ONE day alone, we can at last see what the battle needs to be won. So please, and only if you find this research useful, go check some recent comments froml ast few days and if you agree then hit agree. I need 800 of these. But ONLY if you genuinely agree. No cheating. Please help me hit this algo clean out of the park today. Every man and every woman: this is a call to arms - well, fingers anyway. Please do your bit. This will hopefully stop other pilgrims from falling into the traps unwittingly laid by this mad algorithm.
It's Christmas. In the spirit of giving please give that algo some more serious incoming. I ain't going with a fight. For damn sure.
Note
We can by on a break of the dynamic holding back price offf the highs - stop below the line...hope for a good clean break with enough powwer to break above the highs...if you go long just be careful at the highs....great if we see green candles beat it there...if it stutters and halts close down for small win and go again if and when the line is beatenDisclaimer
The information and publications are not meant to be, and do not constitute, financial, investment, trading, or other types of advice or recommendations supplied or endorsed by TradingView. Read more in the Terms of Use.
Disclaimer
The information and publications are not meant to be, and do not constitute, financial, investment, trading, or other types of advice or recommendations supplied or endorsed by TradingView. Read more in the Terms of Use.