hi guys and girls
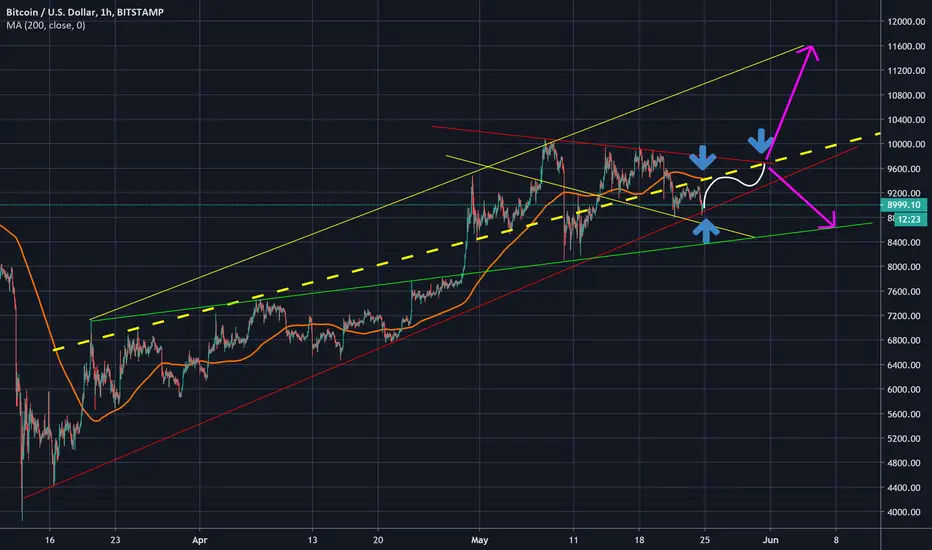
you see at this chart so many resistance and supportive lines and also we can see that the price could be supported by red resistance line and then go on to the higher price and follow the white curve to touch the confluence that is formed by resistance line(red line) and yellow dotted line ( we see that EMA 200 coincide the yellow dotted line) and if breakout this point the price will grow up but if the price can not do this , fall down and could supported by supportive green line
thank u ❤❤
Disclaimer
The information and publications are not meant to be, and do not constitute, financial, investment, trading, or other types of advice or recommendations supplied or endorsed by TradingView. Read more in the Terms of Use.
Disclaimer
The information and publications are not meant to be, and do not constitute, financial, investment, trading, or other types of advice or recommendations supplied or endorsed by TradingView. Read more in the Terms of Use.