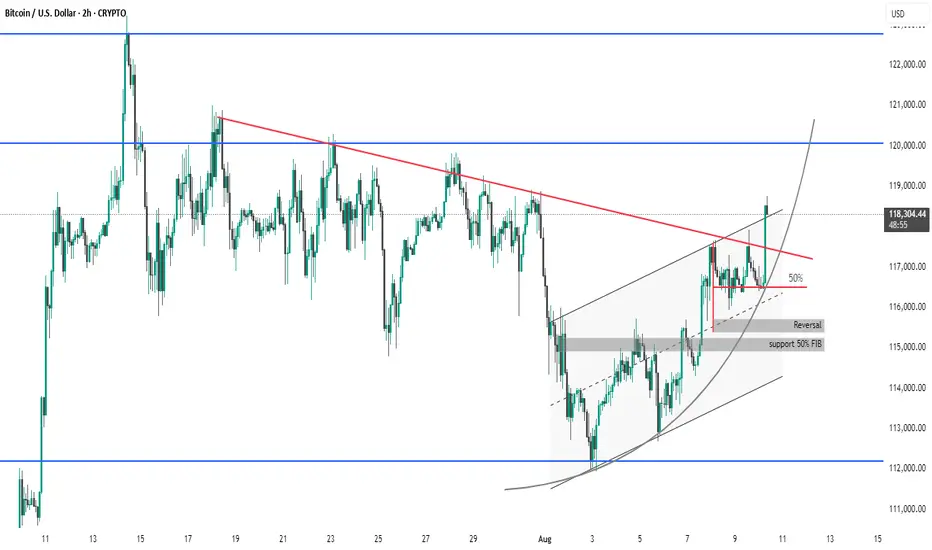
Bitcoin (BTC/USD) 2-hour chart presents several key technical observations:
Breakout Confirmed: Price has successfully broken above the descending red trendline, signaling a potential bullish breakout.
Ascending Channel: BTC is trading within an upward-sloping channel, indicating a strong short-term uptrend.
Support Zones: Multiple supports around $115,000 are identified, including:
50% Fibonacci retracement
Previous reversal zone
Momentum: The current price action has surged past the 50% midline of the channel and is targeting higher resistance levels around $120,000.
Curved Trendline: An upward parabolic curve suggests accelerating bullish momentum.
Summary: Bitcoin is showing strong bullish momentum after breaking key resistance. Watch for a potential retest of the breakout level (~$117,000) before a move higher.
thanks you
Related publications
Disclaimer
The information and publications are not meant to be, and do not constitute, financial, investment, trading, or other types of advice or recommendations supplied or endorsed by TradingView. Read more in the Terms of Use.
Related publications
Disclaimer
The information and publications are not meant to be, and do not constitute, financial, investment, trading, or other types of advice or recommendations supplied or endorsed by TradingView. Read more in the Terms of Use.