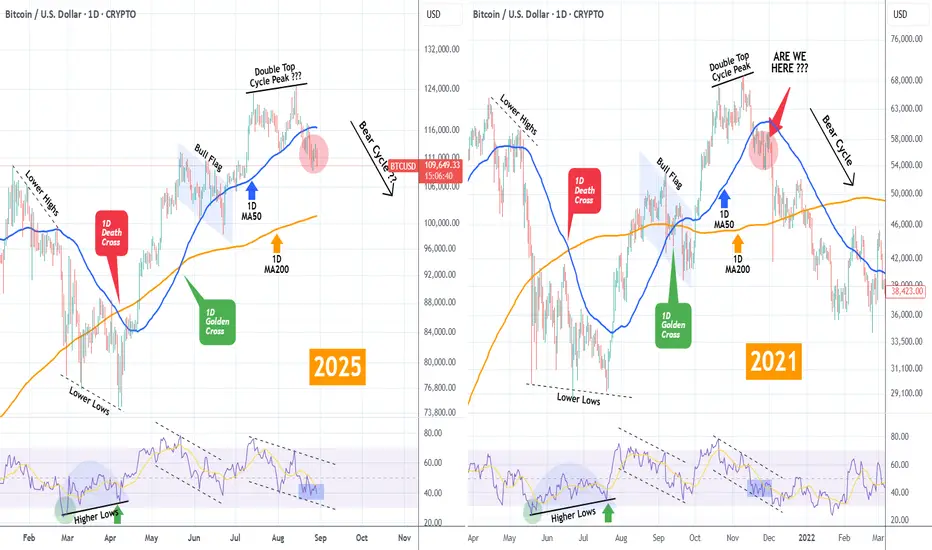
Bitcoin (BTCUSD) has been on a strong correction lately after the August 14 All Time High (ATH) at $124500. Every High since has been sold and the price has found itself below the 1D MA50 (blue trend-line).
Whether that's alarming or not yet, this sequence draws a lot of comparisons with the pattern that led to the Cycle Top on 2021.
As you can see both patterns started off with Lower Highs that pushed the market to a new bottom on Lower Lows. A 1D Death Cross confirmed the bottom formation (along with a 1D RSI bullish divergence on Higher Lows) and BTC started rising aggressively again, flipping both the 1D MA50 and 1D MA200 (orange trend-line) into Supports and forming a Bull Flag on a 1D Golden Cross.
At the end of this sequence in 2021, a Double Top Higher Highs pattern, was what formed the Cycle's Top. Unfortunately for the Bulls' case, this is very similar to the Higher High formation we got on August 14. Even the 1D RSI patterns among those two fractals are similar.
Do you think we are in a similar situation as in late November 2021, which initiated the 2022 Bear Cycle?
Feel free to let us know in the comments section below!
-------------------------------------------------------------------------------
** Please LIKE 👍, FOLLOW ✅, SHARE 🙌 and COMMENT ✍ if you enjoy this idea! Also share your ideas and charts in the comments section below! This is best way to keep it relevant, support us, keep the content here free and allow the idea to reach as many people as possible. **
-------------------------------------------------------------------------------
💸💸💸💸💸💸
👇 👇 👇 👇 👇 👇
👑Best Signals (Forex/Crypto+70% accuracy) & Account Management (+20% profit/month on 10k accounts)
💰Free Channel t.me/tradingshotglobal
🤵Contact info@tradingshot.com t.me/tradingshot
🔥New service: next X100 crypto GEMS!
💰Free Channel t.me/tradingshotglobal
🤵Contact info@tradingshot.com t.me/tradingshot
🔥New service: next X100 crypto GEMS!
Disclaimer
The information and publications are not meant to be, and do not constitute, financial, investment, trading, or other types of advice or recommendations supplied or endorsed by TradingView. Read more in the Terms of Use.