Here's the analysis of the BTCUSD (Bitcoin to USD) chart from Bitstamp, using a 45-minute Line Break [3] chart:
---
Key Observations:
1. Chart Type:
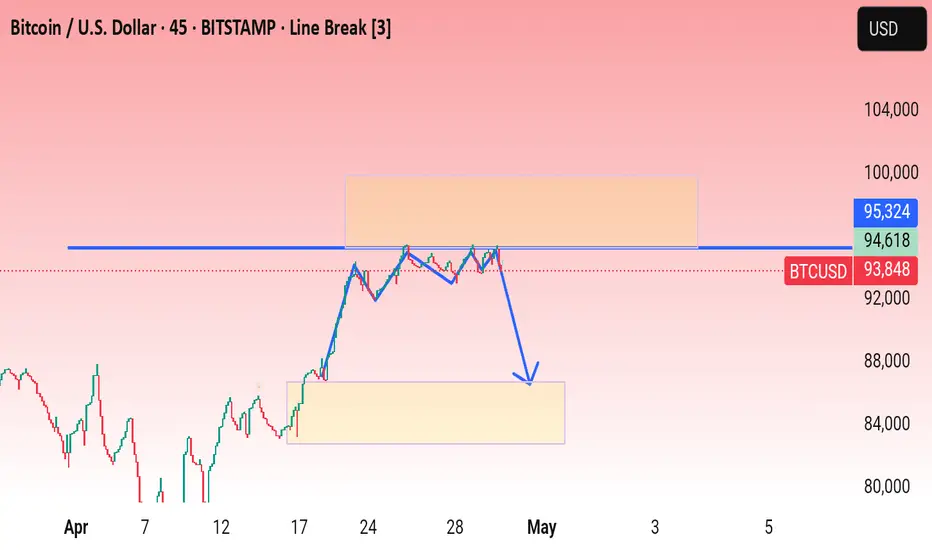
This is a Line Break [3] chart, which filters out small price fluctuations.
It only forms a new line when price breaks the high or low of the previous three lines, offering a clearer trend view.
2. Current Price Levels:
Price: Around 93,848 USD
Sell Price: 94,537 USD
Buy Price: 94,543 USD
3. Structure & Zones:
Resistance Zone (orange shaded): Around 94,556 to 95,324 USD.
Support Zone (yellow shaded): Around 84,000 to 88,000 USD.
Price recently rejected the resistance area and is showing a downward movement.
4. Bearish Breakdown Indicated:
The blue arrow suggests a potential drop to the lower support zone.
The horizontal blue line at around 94,556 could have acted as previous support, now turned resistance.
---
Trading Insight:
Bias: Bearish unless price reclaims and holds above 95,324 USD.
Entry Idea: Short below 93,800–94,000 USD
Target: 88,000–84,000 USD zone
Stop-loss: Above 95,300 USD
Would you like me to help you create a full trade setup or backtest a similar pattern?
---
Key Observations:
1. Chart Type:
This is a Line Break [3] chart, which filters out small price fluctuations.
It only forms a new line when price breaks the high or low of the previous three lines, offering a clearer trend view.
2. Current Price Levels:
Price: Around 93,848 USD
Sell Price: 94,537 USD
Buy Price: 94,543 USD
3. Structure & Zones:
Resistance Zone (orange shaded): Around 94,556 to 95,324 USD.
Support Zone (yellow shaded): Around 84,000 to 88,000 USD.
Price recently rejected the resistance area and is showing a downward movement.
4. Bearish Breakdown Indicated:
The blue arrow suggests a potential drop to the lower support zone.
The horizontal blue line at around 94,556 could have acted as previous support, now turned resistance.
---
Trading Insight:
Bias: Bearish unless price reclaims and holds above 95,324 USD.
Entry Idea: Short below 93,800–94,000 USD
Target: 88,000–84,000 USD zone
Stop-loss: Above 95,300 USD
Would you like me to help you create a full trade setup or backtest a similar pattern?
Disclaimer
The information and publications are not meant to be, and do not constitute, financial, investment, trading, or other types of advice or recommendations supplied or endorsed by TradingView. Read more in the Terms of Use.
Disclaimer
The information and publications are not meant to be, and do not constitute, financial, investment, trading, or other types of advice or recommendations supplied or endorsed by TradingView. Read more in the Terms of Use.