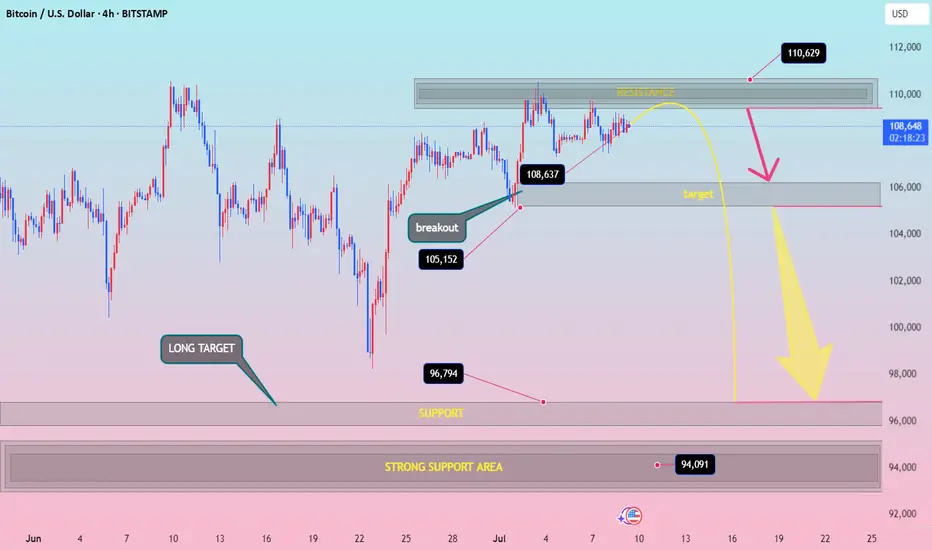
btcusd down idia Resistance Zone: Around 110,000–111,000
Price Action Expectation:
→ Short-term push to 110,629
→ Then rejection toward 105,000, and potentially all the way down to 96,794 or even 94,091
Bearish bias after resistance is hit
⚡ Disruption Analysis (Contrarian View)
✅ 1. Resistance Flip Possibility
What if the 110,000 resistance breaks cleanly with strong volume?
Invalidates the bearish rejection arrow
Could trigger FOMO buying → Acceleration toward 112,500+
Bullish scenario: formation of a bull flag above resistance = continuation setup
✅ 2. Bear Trap Theory at 105,000 Zone
That “target” zone near 105k could be a fake breakdown zone
Market might dip there briefly, lure shorts, then reverse violently
This creates liquidity for a rapid long squeeze breakout
✅ 3. Market Structure Still Bullish on HTF
Higher lows from June 24 to July 6
Clean breakout at 105,152
Still respecting ascending structure — which is not bearish yet
🚨 Disruption Summary Chart Moves
🔼 Alternate Path 1 (Bullish Disruption):
Price consolidates under resistance → breaks above 110,629 → targets 112,500–115,000
🔄 Alternate Path 2 (Fake Breakdown Disruption):
Drops to 105,000, triggers sell-off → sharp reversal → back above 108,637
🔽 Original Path (Rejection-Based Bearish):
Still possible — but not the only high-probability path anymore
Trade active
t.me/Zara_Official_Manager
Daily 3-5 Accurate with Zara Signals
Zara trader
Maximize Your Profits with Our 12+ Years of Trading Experience
Instant Trade Alerts for High-Accuracy Signals
t.me/Zara_Official_Manager
Daily 3-5 Accurate with Zara Signals
Zara trader
Maximize Your Profits with Our 12+ Years of Trading Experience
Instant Trade Alerts for High-Accuracy Signals
t.me/Zara_Official_Manager
Disclaimer
The information and publications are not meant to be, and do not constitute, financial, investment, trading, or other types of advice or recommendations supplied or endorsed by TradingView. Read more in the Terms of Use.
t.me/Zara_Official_Manager
Daily 3-5 Accurate with Zara Signals
Zara trader
Maximize Your Profits with Our 12+ Years of Trading Experience
Instant Trade Alerts for High-Accuracy Signals
t.me/Zara_Official_Manager
Daily 3-5 Accurate with Zara Signals
Zara trader
Maximize Your Profits with Our 12+ Years of Trading Experience
Instant Trade Alerts for High-Accuracy Signals
t.me/Zara_Official_Manager
Disclaimer
The information and publications are not meant to be, and do not constitute, financial, investment, trading, or other types of advice or recommendations supplied or endorsed by TradingView. Read more in the Terms of Use.