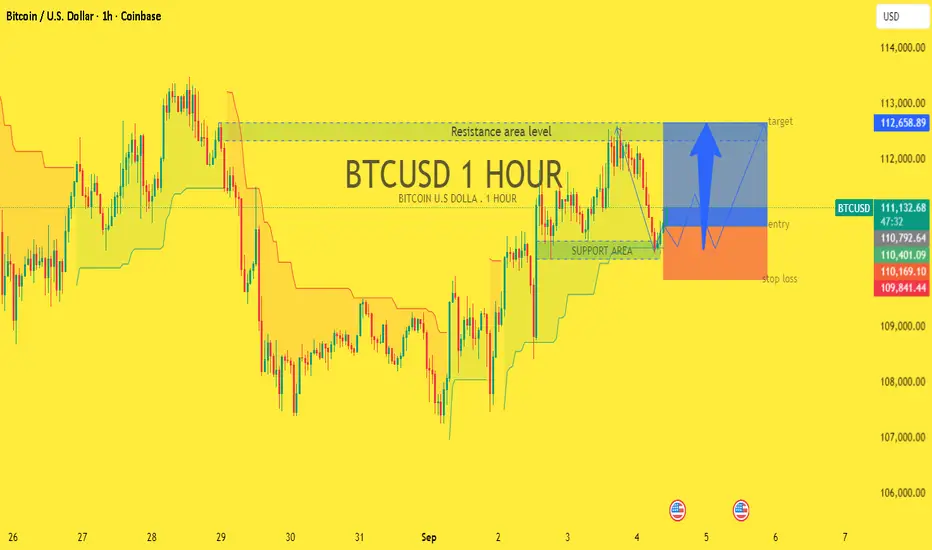
This is a 1H (1-hour) BTC/USD chart demonstrating a potential long setup.
Key Levels
Support area (entry zone): Approximately 110,400 – 110,800
Resistance area: Approximately 112,600 – 113,000
Stop loss: Approximately 109,800 – 110,000
Target: Approximately 112,650 – 113,000
What the chart is indicating
1. Price Action
BTC corrected after reaching resistance around 112.6k–113k.
It's now consolidating around the support area 110.4k–110.8k
The chart indicates a potential bounce from this support.
2. Trade Idea (Long Setup)
Trade closed: stop reached
Stop hitBest Analysis xauusd single
t.me/+uAIef7IqwSs4M2Q0
VIP PREMIMUM ANALYSIS ROOM SIGNALS
t.me/+uAIef7IqwSs4M2Q0
t.me/+uAIef7IqwSs4M2Q0
VIP PREMIMUM ANALYSIS ROOM SIGNALS
t.me/+uAIef7IqwSs4M2Q0
Disclaimer
The information and publications are not meant to be, and do not constitute, financial, investment, trading, or other types of advice or recommendations supplied or endorsed by TradingView. Read more in the Terms of Use.
Best Analysis xauusd single
t.me/+uAIef7IqwSs4M2Q0
VIP PREMIMUM ANALYSIS ROOM SIGNALS
t.me/+uAIef7IqwSs4M2Q0
t.me/+uAIef7IqwSs4M2Q0
VIP PREMIMUM ANALYSIS ROOM SIGNALS
t.me/+uAIef7IqwSs4M2Q0
Disclaimer
The information and publications are not meant to be, and do not constitute, financial, investment, trading, or other types of advice or recommendations supplied or endorsed by TradingView. Read more in the Terms of Use.