Bitcoin (BTC/USD) 4-hour chart analysis:
Chart Summary:
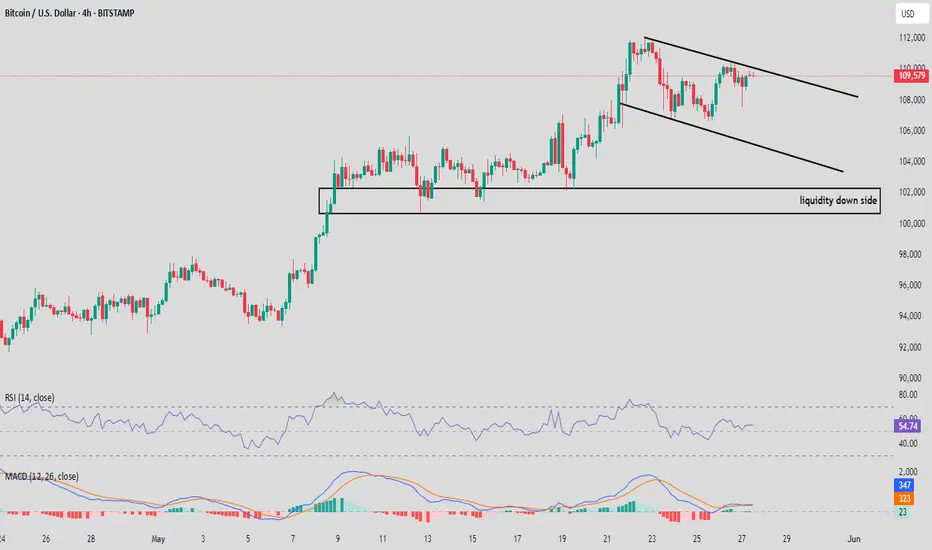
1. Descending Channel Formation:
Price is moving within a downward sloping channel (lower highs and lower lows).
Currently, price is testing the upper boundary of this channel near $109,800.
2. Liquidity Zone (Downside):
Clearly marked liquidity zone between ~$100,000–$102,000.
This suggests potential interest from large players in this area — stop hunts or accumulation possible.
3. Indicators:
RSI (Relative Strength Index): Around 56, which is neutral-bullish. Not overbought, so there's still room for upside, but no strong momentum.
MACD: Bullish crossover is forming; histogram showing momentum shift to the upside.
Key Insights:
Price Rejection or Breakout: Price is at a critical point at the upper trendline. If it breaks above with strong volume, it could indicate a bullish continuation.
Bearish Case (High Probability for Now):
The descending channel is intact.
Price may get rejected and revisit lower bounds near $104,000 or even the liquidity zone near $100,000.
Bullish Case (Breakout Setup):
Break above the channel with a strong bullish candle and retest confirmation may trigger longs.
Target could be previous highs around $112,000–$114,000.
current price: 109580
Suggested Trade Plan:
1. Conservative Short Entry:
If price rejects the upper trendline (around $109,800–$110,000)
Stop-loss above $110,500
Target near $104,000 or $100,000
Chart Summary:
1. Descending Channel Formation:
Price is moving within a downward sloping channel (lower highs and lower lows).
Currently, price is testing the upper boundary of this channel near $109,800.
2. Liquidity Zone (Downside):
Clearly marked liquidity zone between ~$100,000–$102,000.
This suggests potential interest from large players in this area — stop hunts or accumulation possible.
3. Indicators:
RSI (Relative Strength Index): Around 56, which is neutral-bullish. Not overbought, so there's still room for upside, but no strong momentum.
MACD: Bullish crossover is forming; histogram showing momentum shift to the upside.
Key Insights:
Price Rejection or Breakout: Price is at a critical point at the upper trendline. If it breaks above with strong volume, it could indicate a bullish continuation.
Bearish Case (High Probability for Now):
The descending channel is intact.
Price may get rejected and revisit lower bounds near $104,000 or even the liquidity zone near $100,000.
Bullish Case (Breakout Setup):
Break above the channel with a strong bullish candle and retest confirmation may trigger longs.
Target could be previous highs around $112,000–$114,000.
current price: 109580
Suggested Trade Plan:
1. Conservative Short Entry:
If price rejects the upper trendline (around $109,800–$110,000)
Stop-loss above $110,500
Target near $104,000 or $100,000
We provide 3-4 signals every day, including stop loss and big tips along with scalping signal plus more pips targets
t.me/+w5M8RMp21PlkNjZk
t.me/+w5M8RMp21PlkNjZk
Disclaimer
The information and publications are not meant to be, and do not constitute, financial, investment, trading, or other types of advice or recommendations supplied or endorsed by TradingView. Read more in the Terms of Use.